
 Discover Tab Reference Guide
 Discover Tab How-To Guide
 Smart Studies How-To Guide
 Smart Studies Reference Guide
 Scan Tab Reference Guide
 Scan Tab How-To Guide
 Watchlists How-To guide
 Watchlists Reference Guide
 Chatrooms Reference Guide
 Community Wall How-To Guide
 Community Wall Reference Guide
 Streams Reference Guide
 Streams How-To Guide
Linear Reg Slope
Definition
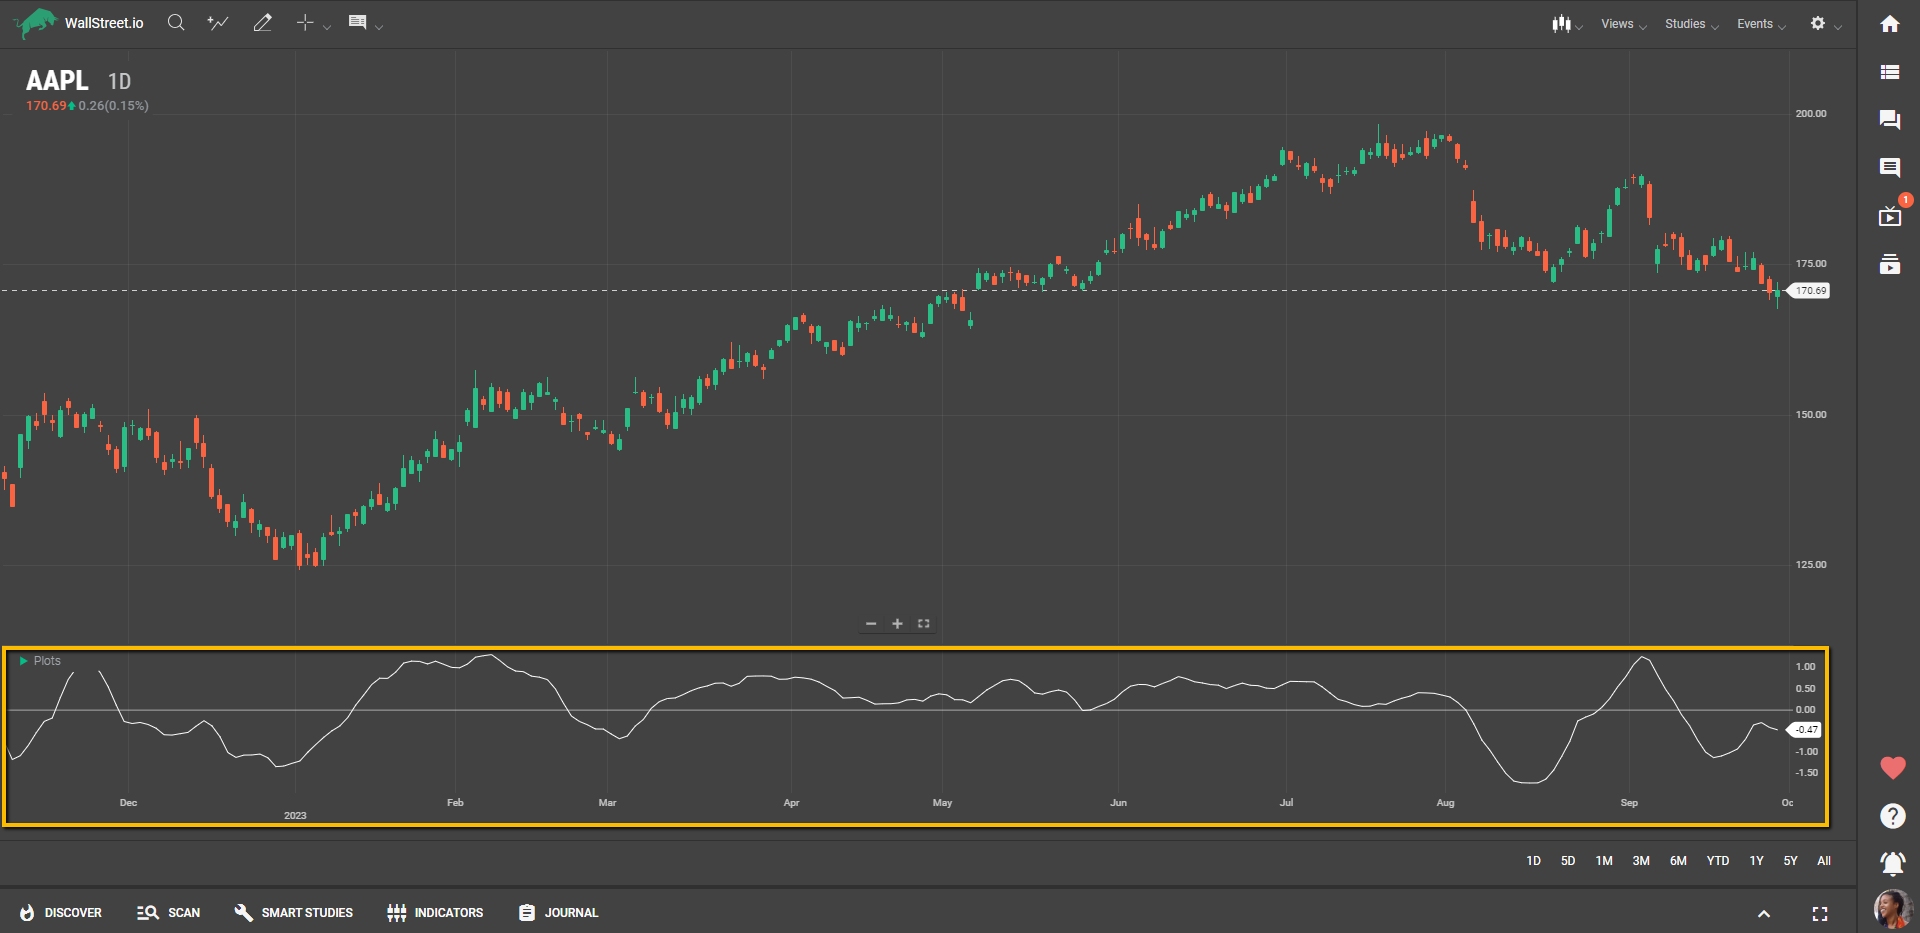
The Linear Regression Slope (LR-Slope) zeroes in on the rate at which a trend is moving. Using the ordinary least squares method, it plots a straight line through historical prices to give you a clear sense of the market direction.
The "ordinary least squares method" is a statistical technique that identifies the straight line that best fits a series of data points by minimizing the distances between those points and the line.
The LR-Slope generates a value for each trading period that represents the "steepness" or "flatness" of the trend line.
Suggested Trading Use
If you're curious about whether a stock is trending upwards or downwards—and how quickly that's happening—then the LR-Slope is your go-to study. A positive slope suggests an upward trend, whereas a negative slope points to a downward trend. The magnitude of the slope can give you an idea of the strength or speed of this movement.
Just like other linear regression studies, you can customize the LR-Slope by adjusting the Field parameter to apply it to other types of data. Utilize the LR-Slope as a real-time gauge for trend direction and strength.