
 Discover Tab Reference Guide
 Discover Tab How-To Guide
 Smart Studies How-To Guide
 Smart Studies Reference Guide
 Scan Tab Reference Guide
 Scan Tab How-To Guide
 Watchlists How-To guide
 Watchlists Reference Guide
 Chatrooms Reference Guide
 Community Wall How-To Guide
 Community Wall Reference Guide
 Streams Reference Guide
 Streams How-To Guide
MACD (Moving Average Convergence Divergence)
Definition
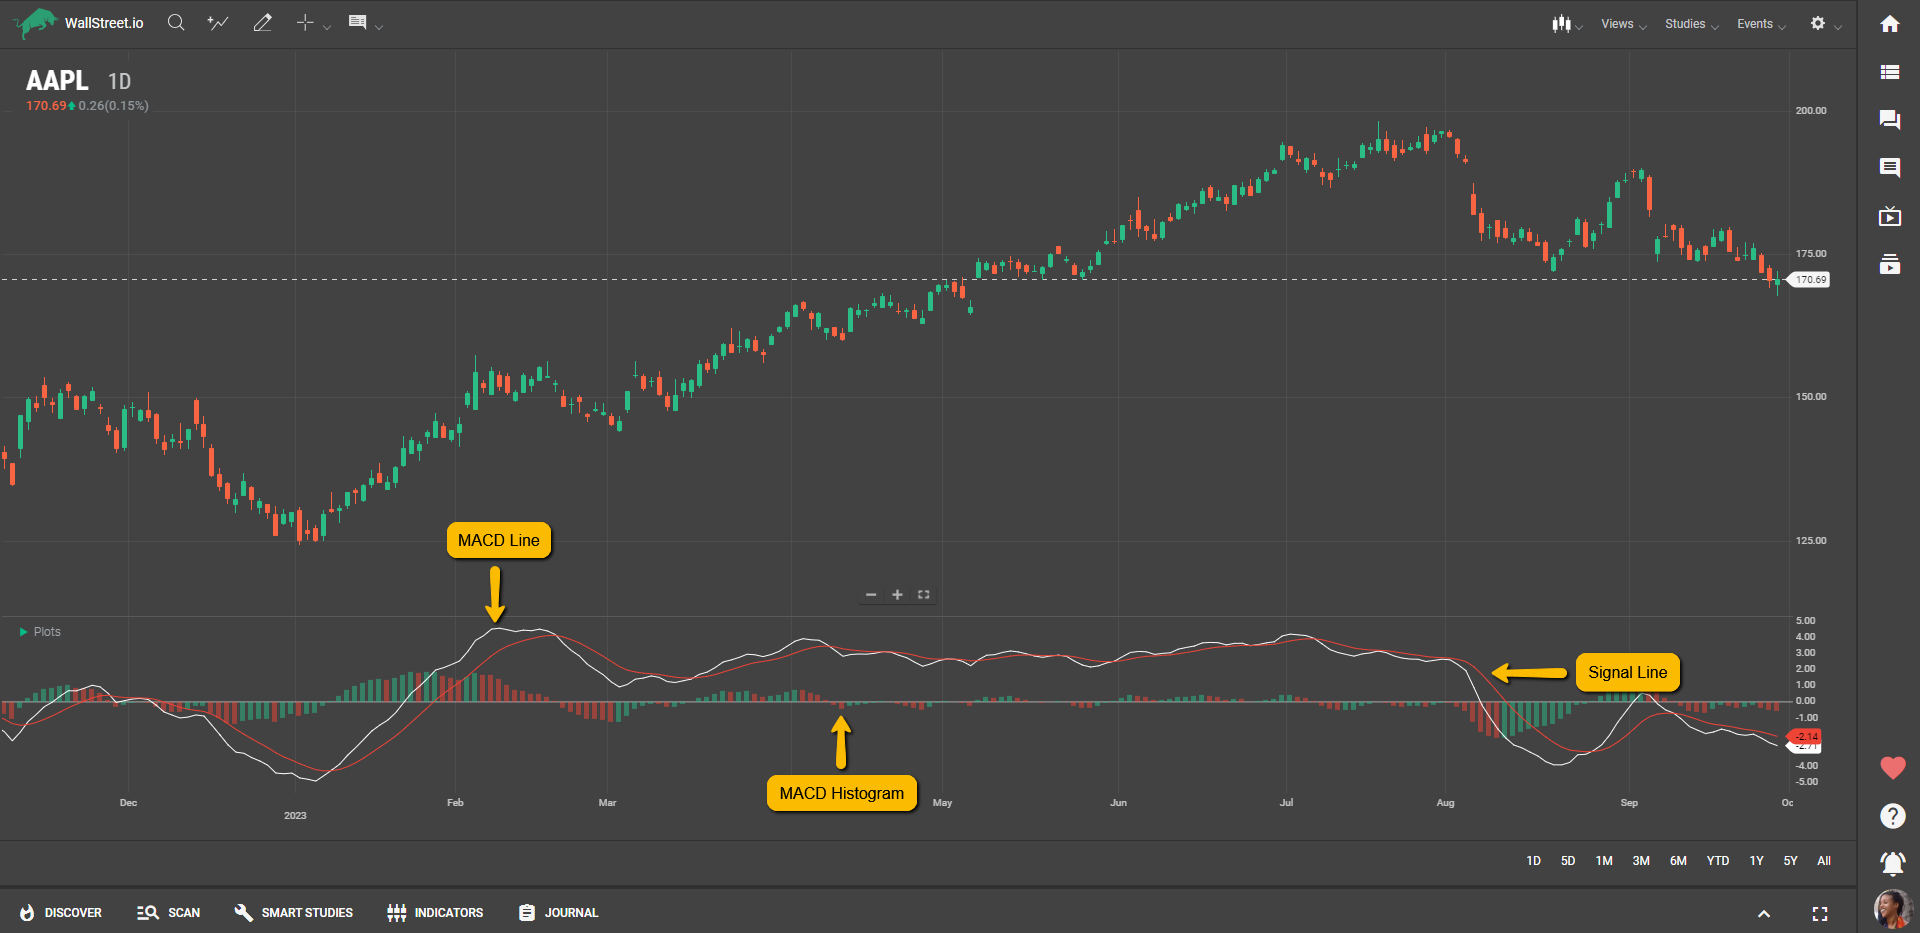
The Moving Average Convergence/Divergence (MACD) is an indicator that leverages the power of exponential moving averages (EMAs) to give you insights into market momentum. It consists of the MACD line, Signal line, and the MACD Histogram.
The MACD line is the difference between two EMAs of different periods, and the Signal line is an EMA of the MACD line itself. The MACD Histogram serves as a visual representation of the distance between the MACD line and the Signal line.
Suggested Trading Use
When you want to capture the essence of an asset's momentum, the MACD is a potent tool in your arsenal. If the MACD line crosses above the Signal line, it's often considered a bullish sign; a cross below can be interpreted as bearish. The MACD Histogram offers additional clarity: if it's moving in the opposite direction to the asset's price, it could be an early warning sign of a possible trend reversal.