Financial Window Reference Guide
In the Financial Window, you’ll find the Overview Stats section, where you’ll find information on the sector, market cap, and other relevant information about the symbol.
Here, you can also locate the total number of strategies on our platform for this particular symbol, the number of strategies considered to be “Top Strategies” by our Discover Tool algorithm, and the number of strategies starting today.
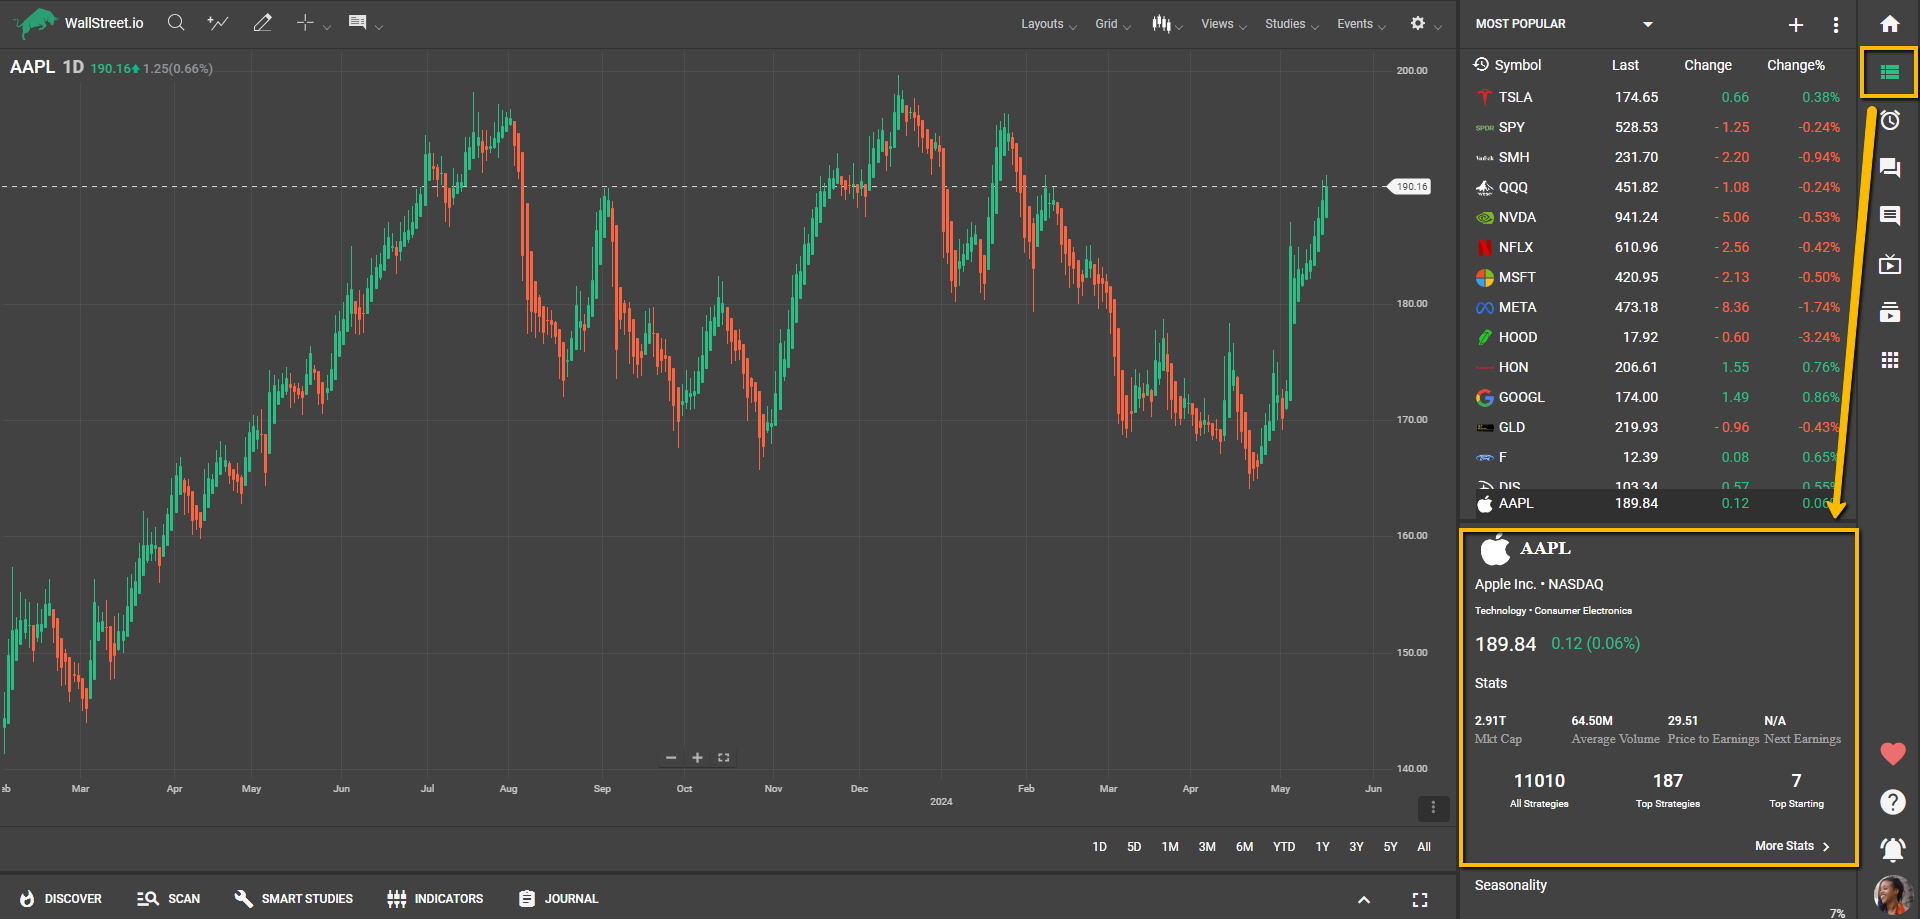
Below the Stats, you will also find the Seasonality graphs showing the return percentages of the selected timeframe (weekly, monthly, or yearly).
At the bottom of the Financial Window, the symbol’s Profile section will provide business-related information about the selected financial instrument and a description, if applicable.

Let’s dive deeper into each of these Financial Window sections:
Stats section
- Open: The opening price of a financial instrument refers to the price at which it started trading at the beginning of a particular period, such as a trading session or market day.
- High: The high price represents the highest trading price reached by the financial instrument during a given period, typically within a trading session or market day.
- Low: The low price indicates the lowest trading price reached by the financial instrument during a specific period, usually within a trading session or market day.
- Close: The closing price refers to the final trading price of the financial instrument at the end of a particular period, such as a trading session or market day.
- Name: The name refers to the official name or title of the financial instrument, which helps identify it uniquely among other instruments.
- Exchange: The exchange indicates the stock exchange or marketplace where the financial instrument is traded, such as the New York Stock Exchange (NYSE), NASDAQ, or London Stock Exchange (LSE).
- Sector: The sector represents the broad category or industry group to which the company issuing the financial instrument belongs. Sectors can include technology, healthcare, finance, consumer goods, etc.
- Industry: The industry provides a more specific classification of the company's line of business within a particular sector. For example, within the technology sector, industries could include software, hardware, or telecommunications.
- Market Cap: Market capitalization refers to the total value of a company's outstanding shares in the market. It is calculated by multiplying the current share price by the number of shares outstanding.
- Avg. Volume: Average volume represents the average number of shares traded in the financial instrument over a specific period, typically measured on a daily or weekly basis.
- PE: PE (Price-to-Earnings) ratio is a valuation metric that compares the current market price of a company's stock to its earnings per share (EPS). It is used to assess the relative value of a stock and can provide insights into the company's earnings potential.
- EPS: EPS (Earnings Per Share) is a financial measure that represents a company's profit allocated to each outstanding share of its common stock. It indicates the company's profitability on a per-share basis.
- Shares Outstanding: Shares outstanding refers to the total number of shares issued by a company and held by its shareholders.
- Year High: Year high represents the highest trading price that the financial instrument has reached within the past year.
- Year Low: Year low indicates the lowest trading price that the financial instrument has reached within the past year.
- Next Earnings Announcement: The next earnings announcement refers to the scheduled date or period when a company will release its latest financial results, providing insights into its financial performance.
- Avg. Price 50MA: Refers to the average price of the financial instrument over the last 50 days, calculated using a moving average technique.
- Avg. Price 200MA: Represents the average price of the financial instrument over the last 200 days, calculated using a moving average technique.
These terms provide essential information about a financial instrument's price, trading characteristics, company details, and market performance.
Seasonality section
The Seasonality graph is useful to go back in history and see how a specific symbol has been behaving over time and compare it year to year, month to month, or even week to week. At first glance, it will display the monthly seasonal candles.
By clicking on More Seasonality, it’ll allow you to change the Seasonality timeframe to have Yearly Bars, Monthly Bars, or Weekly Bars.
By selecting Weekly, you’ll also be able to select the Month of the year.
Once you hover your mouse over a bar, you will see the buy-and-hold return percentage of the instrument. If you select Monthly or Weekly, you’ll also see the list of the return percentages in the selected timeframe but from previous years.
Earnings Per Share chart
This tool is designed to improve how earnings data is visualized, offering a clear view of the past year's EPS and, when available, projections for the next year.
By hovering over the chart, you’ll find relevant information such as the estimated EPS, the actual resulting EPS for that time period and its change percentage.
Profile section
This section will provide business-related information about the selected financial instrument and a description, if applicable. The first section will show you the number of employees, the ISIN number, and the company’s website.
By clicking on Show Profile, it’ll show you extended information about the financial instrument, if applicable:
- Name
- Website
- Name of the CEO
- Number of Employees
- IPO (Initial Public Offering) date
- ISIN (International Securities Identification Number)
- City
- State
- Address
- Zip
- Country
- Phone