
 Discover Tab Reference Guide
 Discover Tab How-To Guide
 Smart Studies How-To Guide
 Smart Studies Reference Guide
 Scan Tab Reference Guide
 Scan Tab How-To Guide
 Watchlists How-To guide
 Watchlists Reference Guide
 Chatrooms Reference Guide
 Community Wall How-To Guide
 Community Wall Reference Guide
 Streams Reference Guide
 Streams How-To Guide
Ichimoku Cloud
Definition
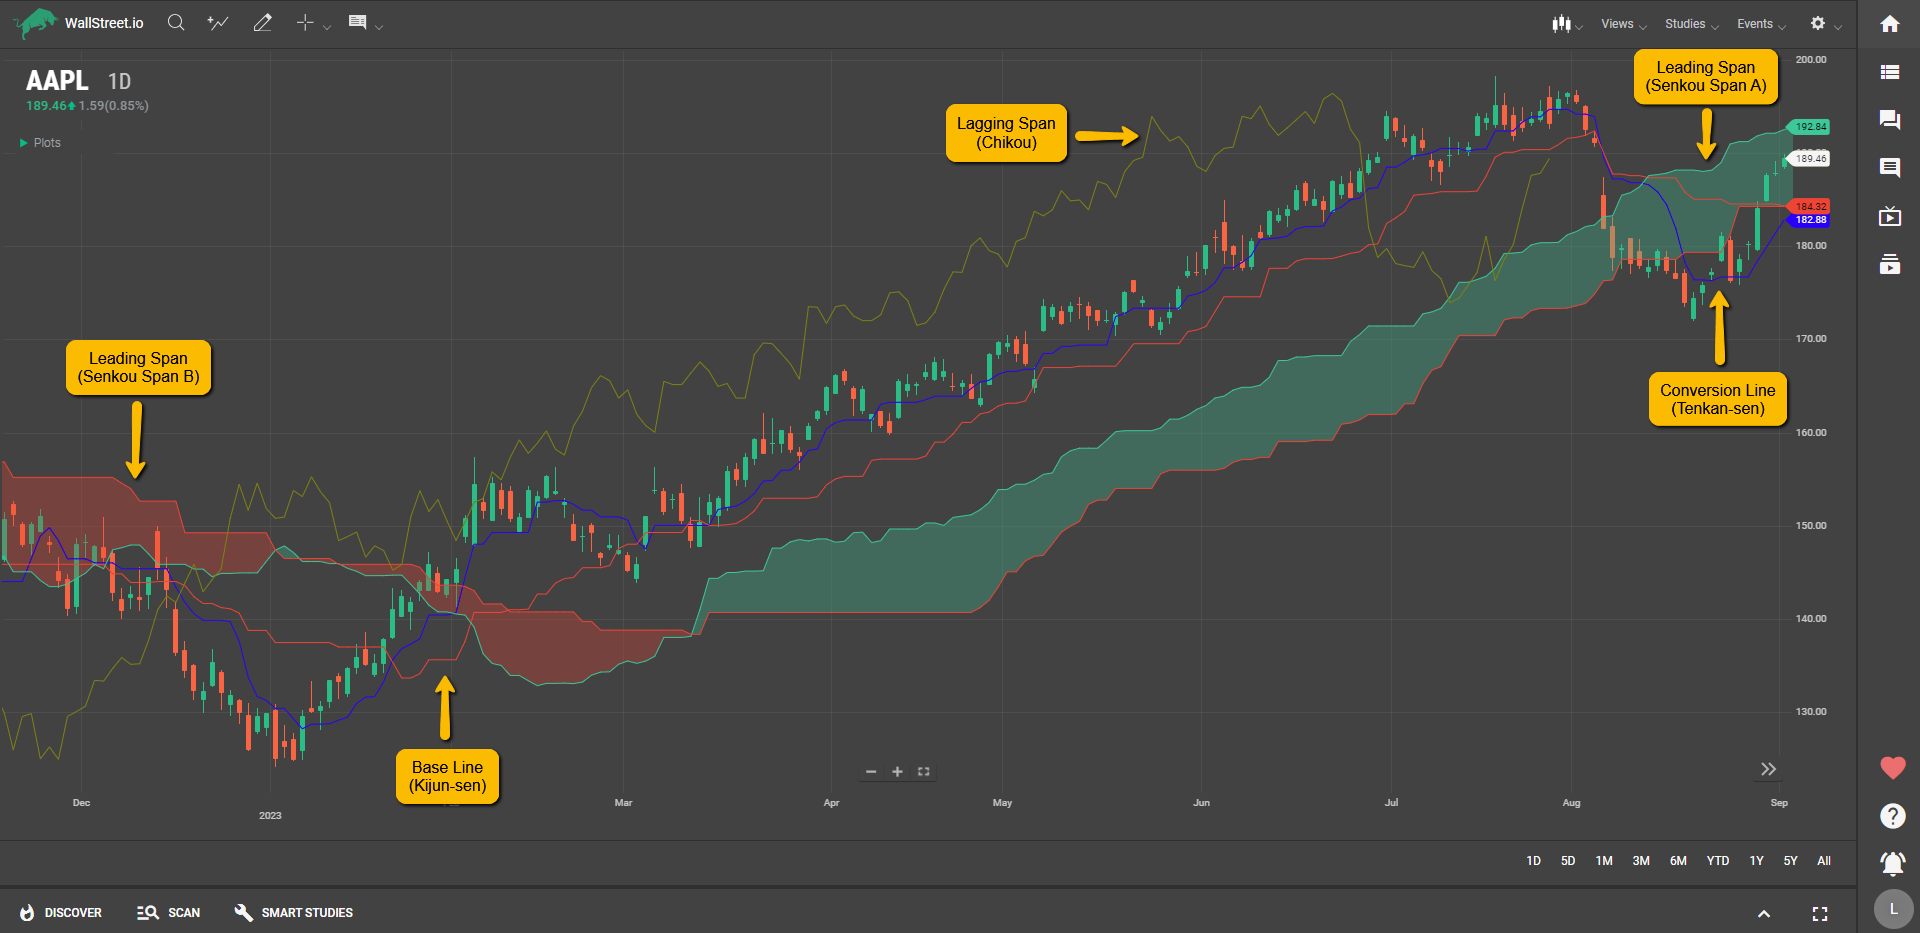
The Ichimoku Cloud is a comprehensive study that gives you a "one-look" snapshot of an asset's support/resistance levels, momentum, and trend direction. It consists of five lines: Tenkan Sen, Kijun Sen, Senkou Span A, Senkou Span B, and Chikou.
These lines create various "clouds" that help you quickly identify key areas in the market.
Suggested Trading Use
When the price is above the cloud, that's a bullish signal, suggesting it might be a good time to consider a long position. Conversely, if the price is below the cloud, the market is bearish, and you might consider shorting the asset. The Tenkan Sen and Kijun Sen lines also serve as dynamic support and resistance levels: crossing above is generally bullish, while crossing below is bearish.
The cloud itself can act as a region of support or resistance. If you're in a trade, pay attention to how the price interacts with the cloud. A strong trend will often be confirmed by the price staying consistently on one side of the cloud.
Remember, the Ichimoku Cloud offers a lot at a single glance, but it's always wise to corroborate its readings with other aspects of your trading strategy.