Multi-Chart Grid Reference Guide
Our Multi-Chart (also known as “Grid”) is designed to enhance your market analysis and strategy comparison. This powerful feature enables you to view multiple charts simultaneously, offering a comprehensive perspective of the markets at a glance.
Whether you're tracking different securities, analyzing various time frames, or applying multiple strategies, the Multi-Chart Grid is your command center for a detailed and efficient analysis.
In this guide, we'll walk you through the functionalities available in the Multi-Chart dropdown menu, helping you to customize your charting experience and maximize your analytical capabilities:
Grid
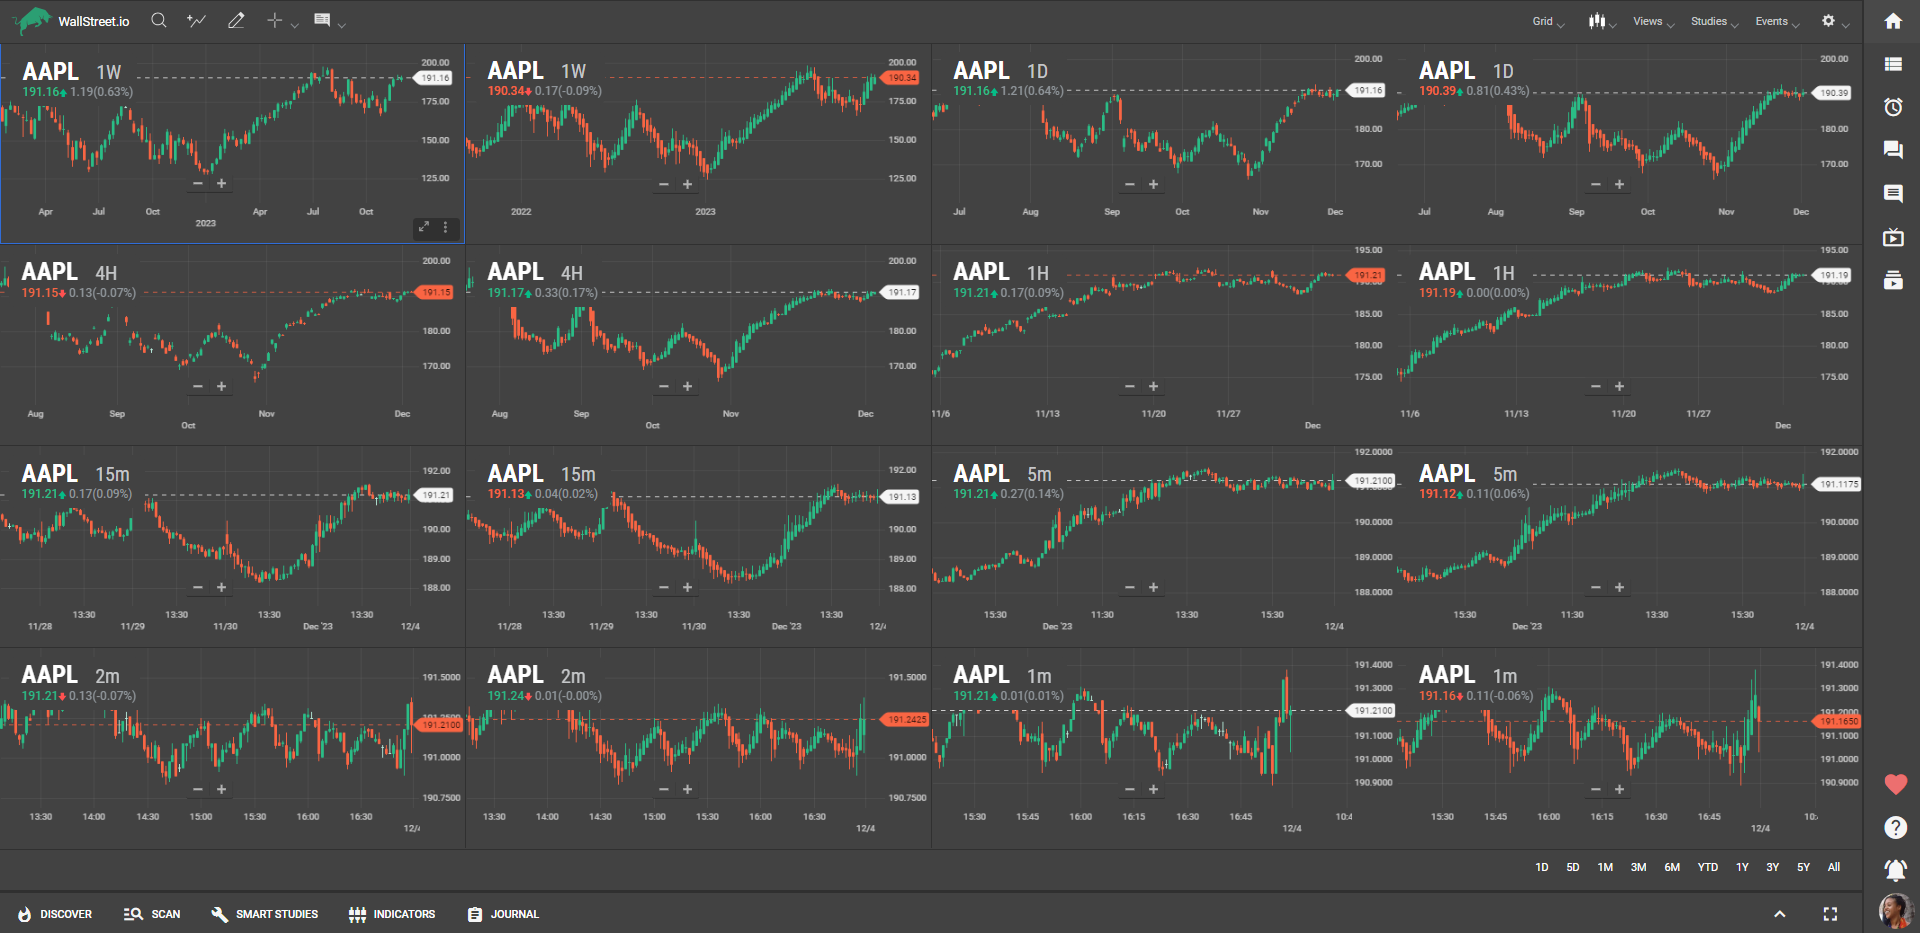
By clicking on the 'Grid' dropdown menu from the Chart Menu Bar, you can choose from a variety of grid templates for displaying multiple charts simultaneously. Each template represents a different arrangement for organizing charts on your screen, allowing you to compare different stocks, time frames, or strategies side by side:
Templates
A collection of predefined grid templates is available for quick selection. These range from simple three-chart setups to complex grids that display up to sixteen charts at once. Select a template that matches the number of charts you want to view and the comparison style you prefer.
By clicking on one of the charts, you’ll see it’ll become highlighted with a blue outline. That’s how you know that’s the chart you’ve selected and that will reflect any changes you make to it:
Sync Settings
Enhance your analysis by synchronizing settings across all charts in your selected grid.
• Symbol: When toggled on, changing the stock symbol in one chart will update all charts to that symbol, allowing for multi-timeframe analysis of the same stock.
• Interval: Activating this option ensures that all charts reflect the same time interval, making it easier to compare different strategies or indicators over the same period.
• Chart Types: Keep your chart types in sync. Whether you're using candlesticks, bars, or lines, this setting provides a uniform view across all charts.
• Strategies: If you're comparing different strategies, this toggle will apply the selected strategy across all charts for consistent strategy analysis.
Each of these settings can be independently toggled to suit your analysis needs, providing flexibility in how you compare and contrast different information.
Saving Multi-Chart Setups with Layouts
To preserve your Multi-Chart Grid setup, you must use the Layouts feature. Here's how it works:
Prepare Your Multi-Chart Grid Setup
Configure your Multi-Chart Grid to your preference (e.g., grid size, symbols, intervals, chart types, and strategies for each chart), then define the Multi-Chart Toggle Buttons (Symbol, Interval, Chart Types, and Strategies) in the Grid Menu to control syncing behavior across charts.
Save Your Setup with a Custom Layout
Once your Multi-Chart setup and toggles are configured, save it as a custom Layout by clicking on “Save Layout” via the Layouts Menu in the Chart Menu Bar. This new custom Layout will capture the grid size, chart content, and toggles' initial state.
Understanding the Sync Behavior
The Multi-Chart Toggles in the Grid Menu override the saved Layout setup when you load the Layout.
For example, if you save a Layout with a 2x2 grid where each chart has different symbols but later enable the Symbol Sync Toggle, all charts in the grid will sync to the active chart's symbol—even if the Layout initially saved different symbols for each chart.
Multi-Chart Toggle Overrides
Here’s an example of how the toggle settings affect your saved Layout:
• You save a custom Layout with a 2x2 grid, where each chart displays different symbols (e.g., AAPL, MSFT, AMZN, TSLA).
• Later, when you load this Layout, the Symbol Sync Toggle is turned on.
• Despite the Layout being saved with different symbols, all charts will automatically sync to the symbol of the active chart due to the enabled toggle.
Best Practices
• Set Toggles Before Saving a Layout: Ensure your toggles are in the desired state (on or off) before saving the Layout. This helps preserve your intended behavior when loading the Layout.
• Double-Check Toggle Status: After loading a Layout, confirm the toggles' status to ensure the grid behaves as you expect.
• Save New Layouts for Alternate Sync Setups: If you need different toggle configurations, consider saving them as separate Layouts.
A Note on Backtesting with Multi-Chart
As you delve into the multi-dimensional analysis with our Multi-Chart feature, it's essential to understand the interaction with our Smart Studies (backtesting) capabilities.
Each chart within your grid operates as an independent backtesting workspace. This means that as you switch between charts, the backtest you've set up or the strategy you're analyzing won't automatically carry over to the next chart.
This might initially cause some confusion — a backtest that was visible on one chart might seem to disappear when you select another chart. However, rest assured, your strategy isn't gone; it's simply contained within the chart where it was originally set up. This design allows you to maintain different strategies or backtests across multiple charts without interference, providing a more organized and focused trading analysis experience.
When you click on a specific chart, it brings that chart's individual settings, indicators, and backtests to the forefront, while the others remain in the background, holding their unique configurations intact. This ensures that each chart remains a distinct analytical environment, allowing for precise and isolated strategy testing.