Bollinger Bands
Bollinger Bands is a popular technical analysis tool that can provide valuable insights into market volatility and potential price reversals.
1: Add Bollinger Bands to your Chart
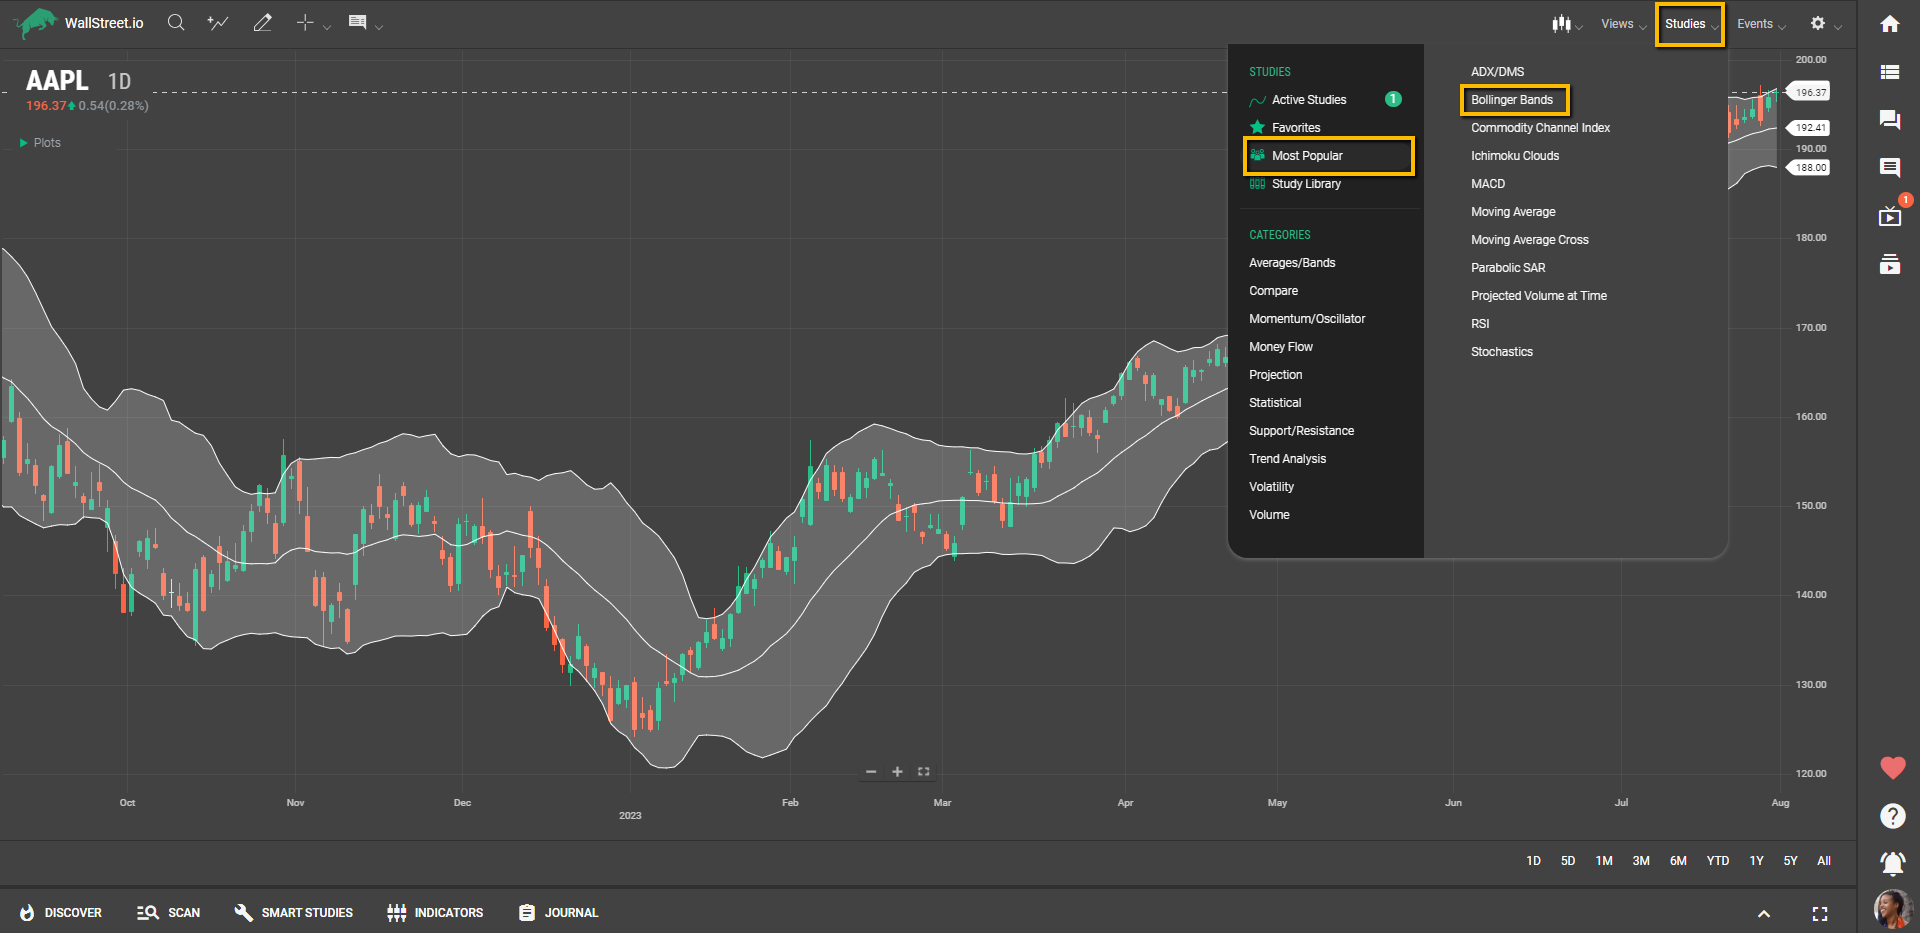
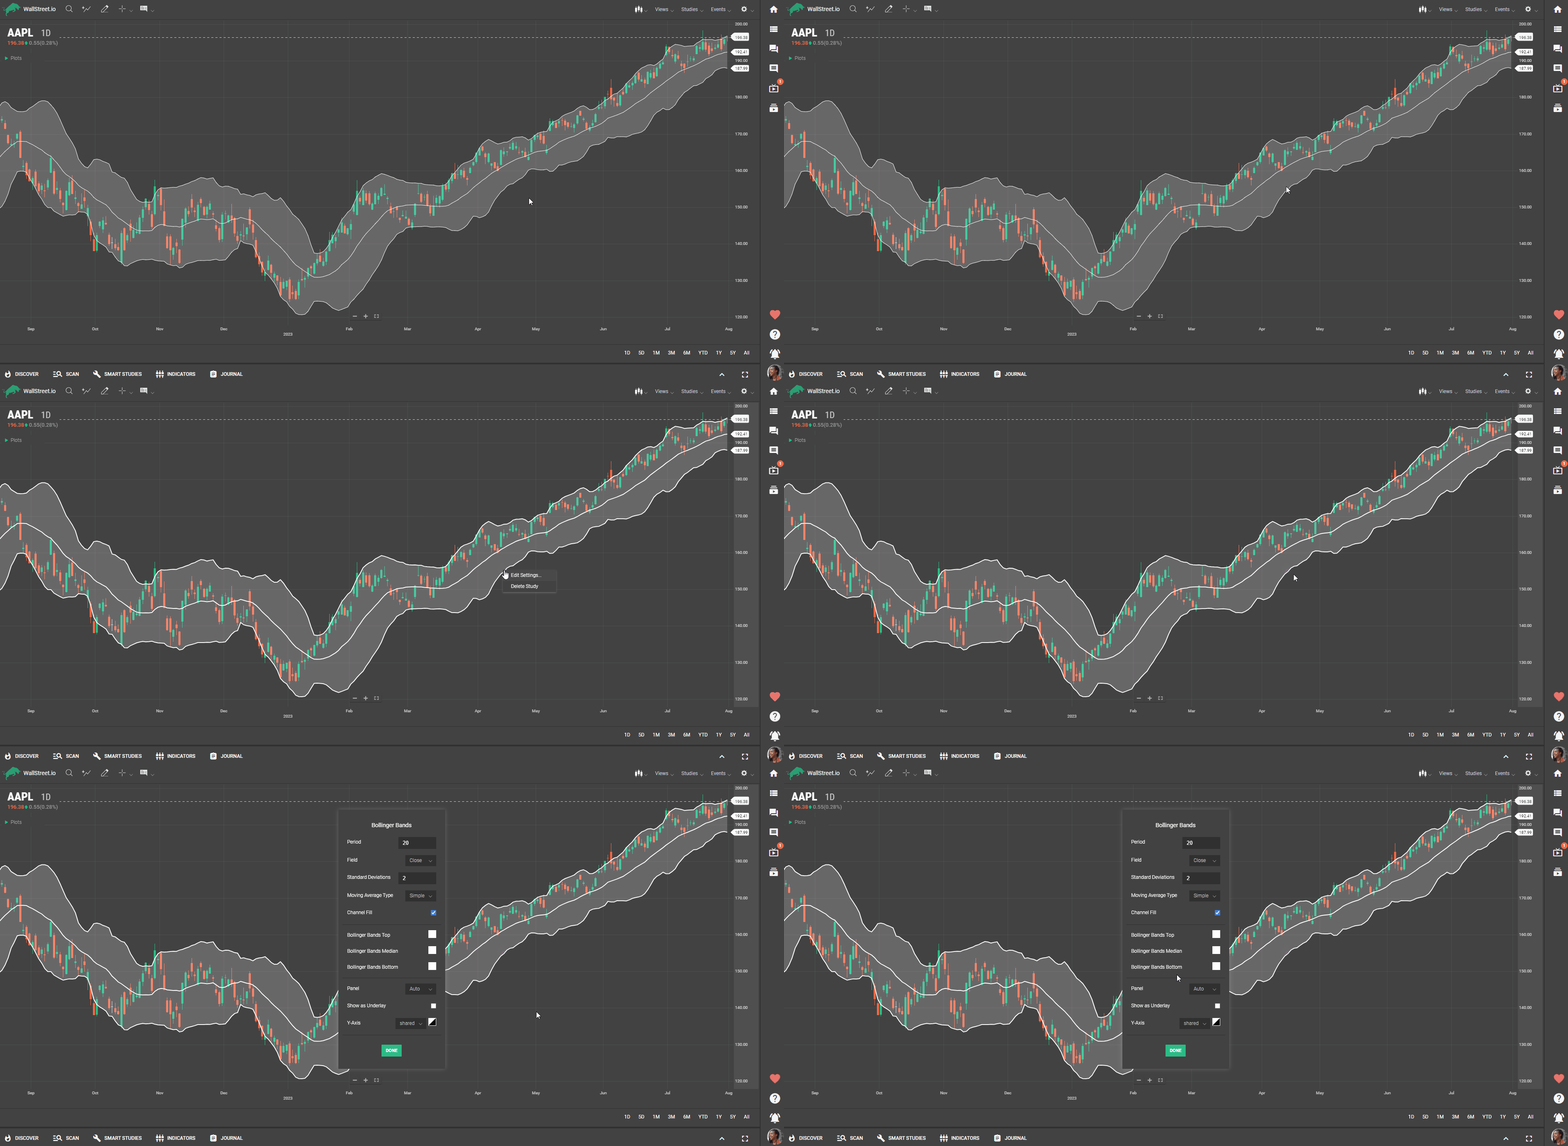
Select the Bollinger Bands from the list of our available Studies.  Adjust the settings if desired, such as the period length (commonly set to 20) or the color scheme for better visualization. You can do this by right-clicking on the Bollinger Bands and choosing “Edit Settings”.
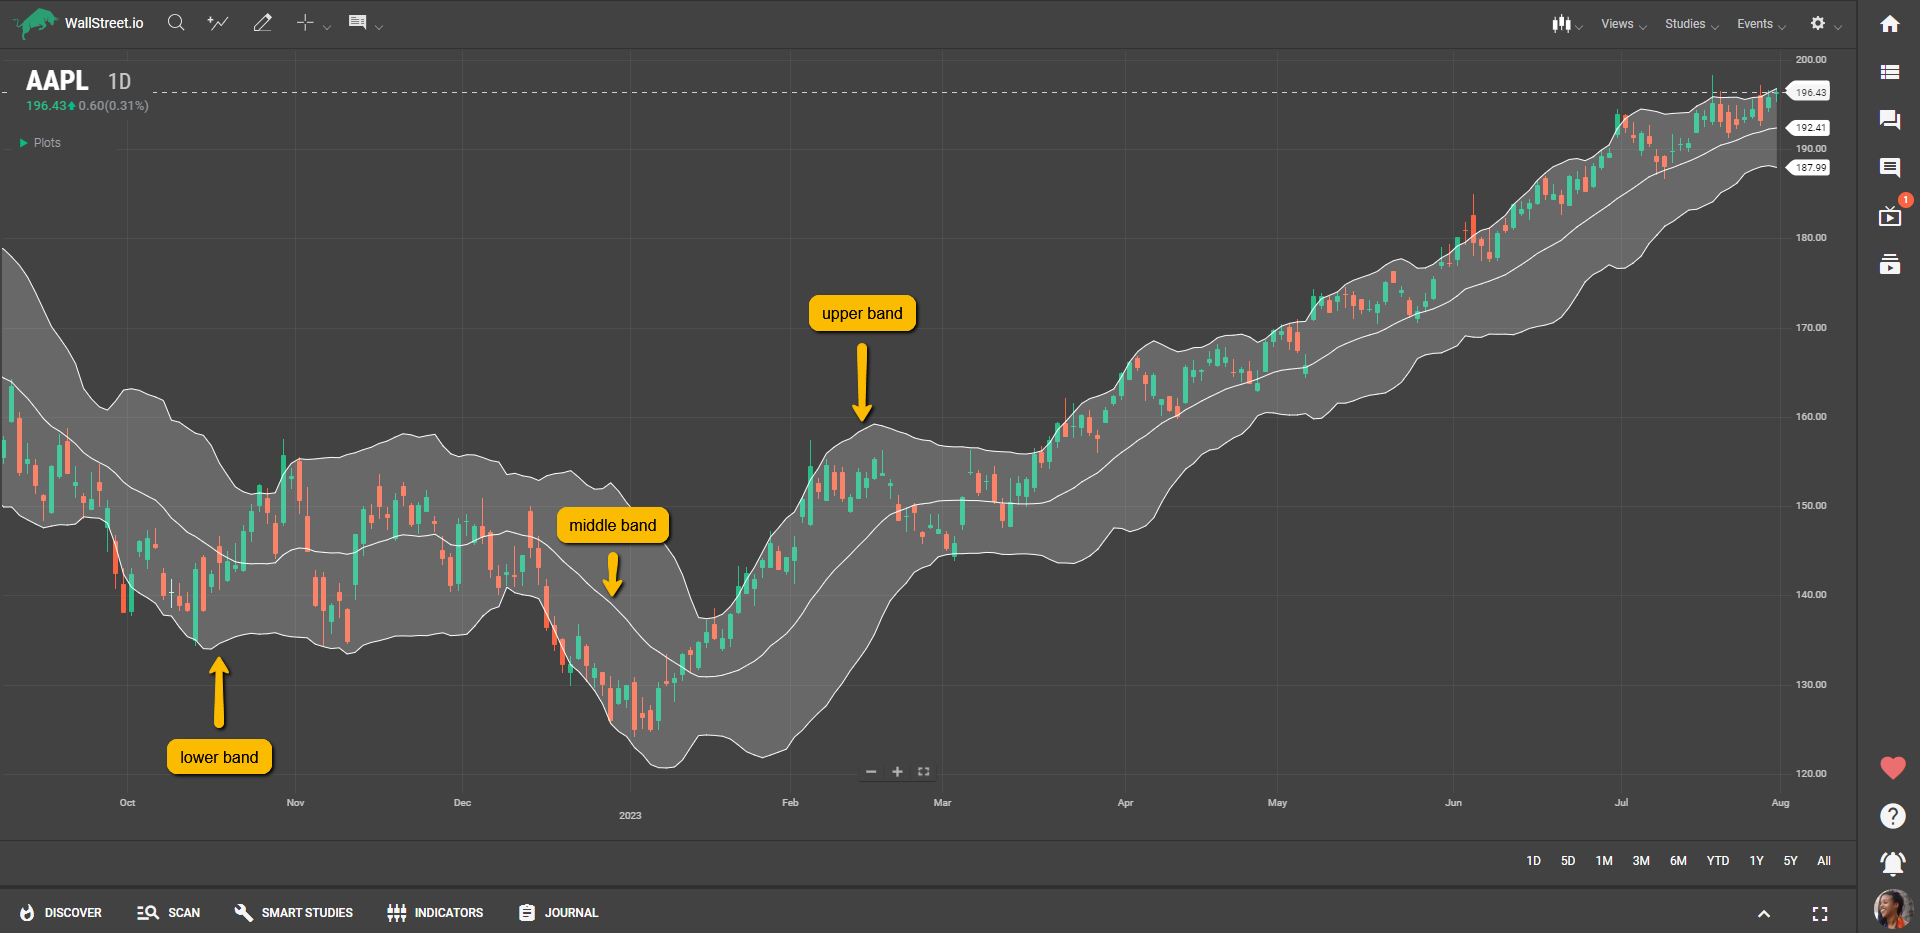
 By default, Bollinger Bands consist of three lines: the middle band (20-period simple moving average), the upper band (standard deviations above the middle band), and the lower band (standard deviations below the middle band).
2: Understand the Components of Bollinger Bands
The middle band represents the average price over a specific period and can act as a dynamic support or resistance level.The upper band indicates the overbought zone, suggesting that prices may be reaching an extreme and could potentially reverse.The lower band indicates the oversold zone, suggesting that prices may be reaching an extreme and could potentially bounce back up.3: Interpret Bollinger Band Squeezes and Expansions
When the distance between the upper and lower bands narrows, it indicates a period of low volatility, known as a Bollinger Band squeeze. This may suggest that a significant price move is imminent.Conversely, when the distance between the bands expands, it indicates increased volatility and potential trading opportunities.4: Identify Overbought and Oversold Conditions
When prices touch or exceed the upper band, it suggests an overbought condition, indicating that the asset may be due for a downward correction.When prices touch or fall below the lower band, it suggests an oversold condition, indicating that the asset may be due for an upward rebound.Tips and Best Uses:
Bollinger Bands are particularly useful in trending markets, as they can help identify potential entry and exit points.Adjust the period and standard deviation settings based on your trading style and the timeframe you’re analyzing.Be cautious of false breakouts or whipsaw signals that may occur during periods of low volatility.To better understand the concepts used in this guide, check out our Bollinger Bands Reference Guide.


 Discover Tab Reference Guide
 Discover Tab How-To Guide
 Smart Studies How-To Guide
 Smart Studies Reference Guide
 Scan Tab Reference Guide
 Scan Tab How-To Guide
 Watchlists How-To guide
 Watchlists Reference Guide
 Chatrooms Reference Guide
 Community Wall How-To Guide
 Community Wall Reference Guide
 Streams Reference Guide
 Streams How-To Guide