Chart Menu Bar Reference Guide
This guide aims to support you in mastering the broad range of functionalities embedded in our Chart Menu Bar. The array of chart types and aggregated types, together with the ability to create and manage custom views, brings depth and flexibility to your market analysis process.
You can enrich your charts with technical indicators from the Studies section and annotate notable time-based events, like Earnings. Moreover, with the option to fine-tune your Chart Preferences, you can tailor your market visualizations to fit your unique trading style. Whether you're a novice or an experienced trader, this guide will assist you in harnessing the full potential of our platform, empowering you to interpret market data more effectively.
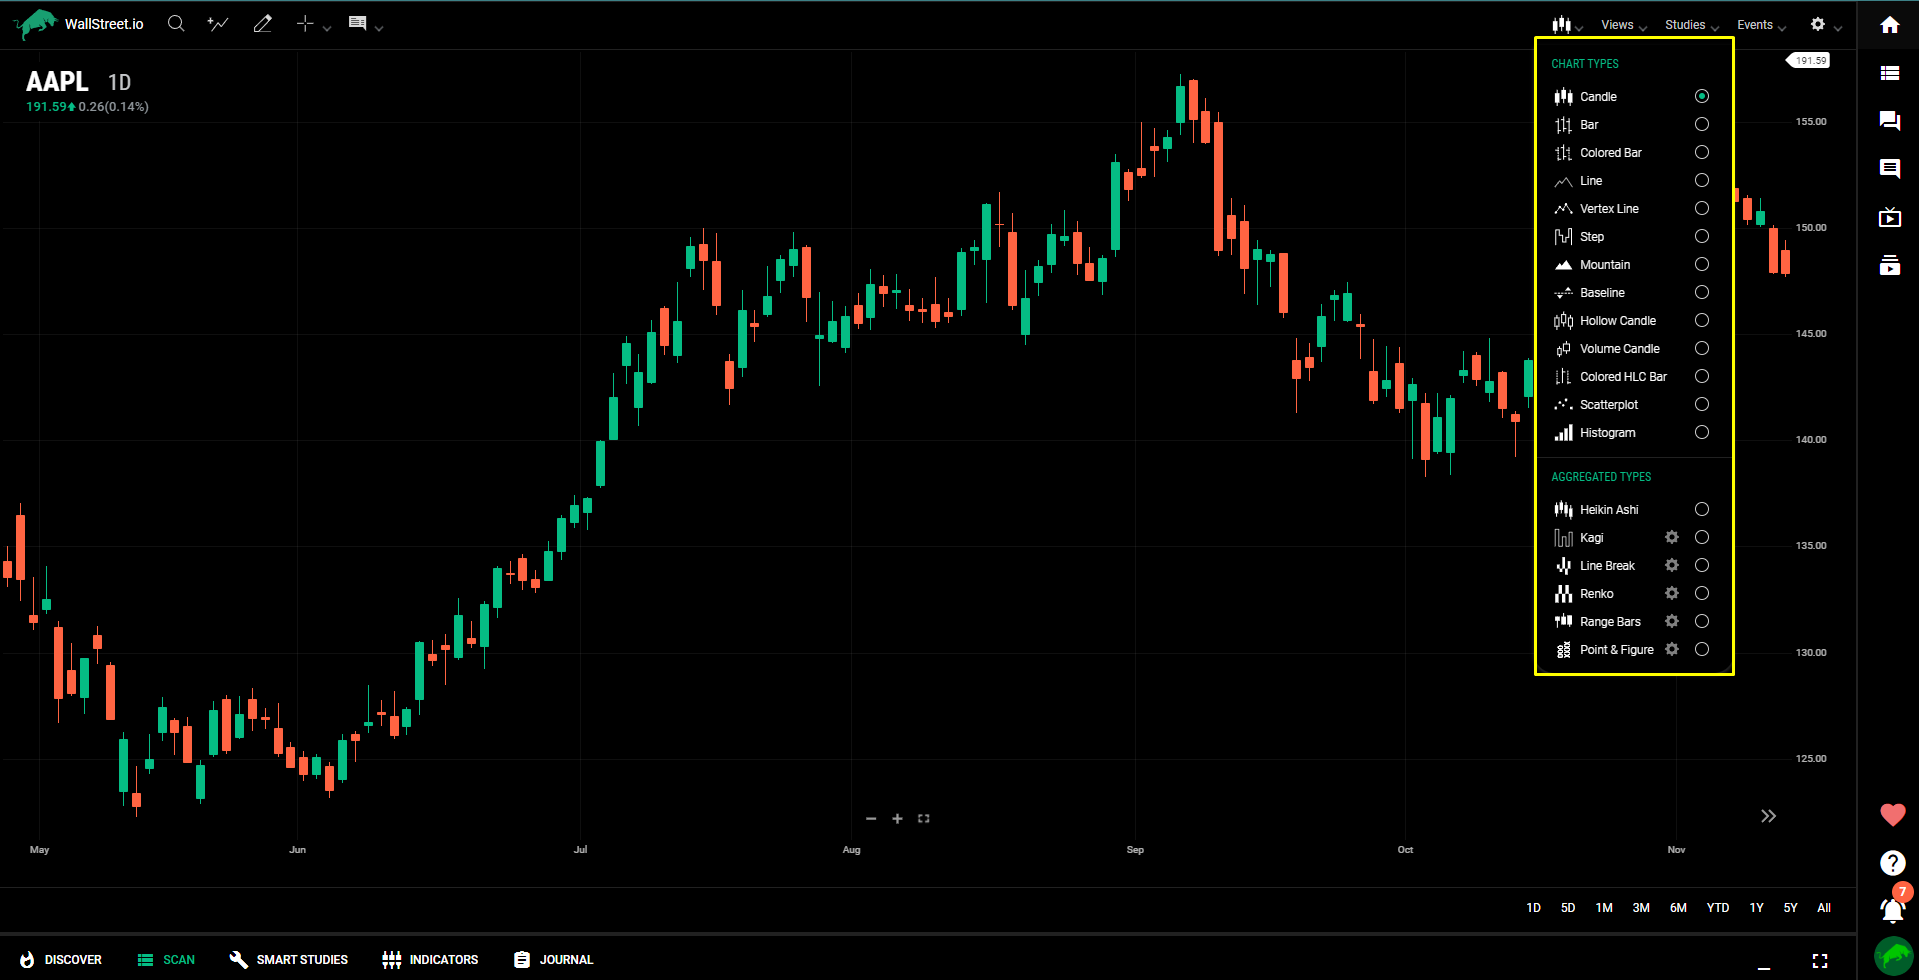
Chart Types
Our charting library supports a variety of chart types, and is divided into two sections: Chart Types and Aggregated Types.
Explore our Chart Types Reference Guide to delve deeper into the definitions and characteristics of each chart type.
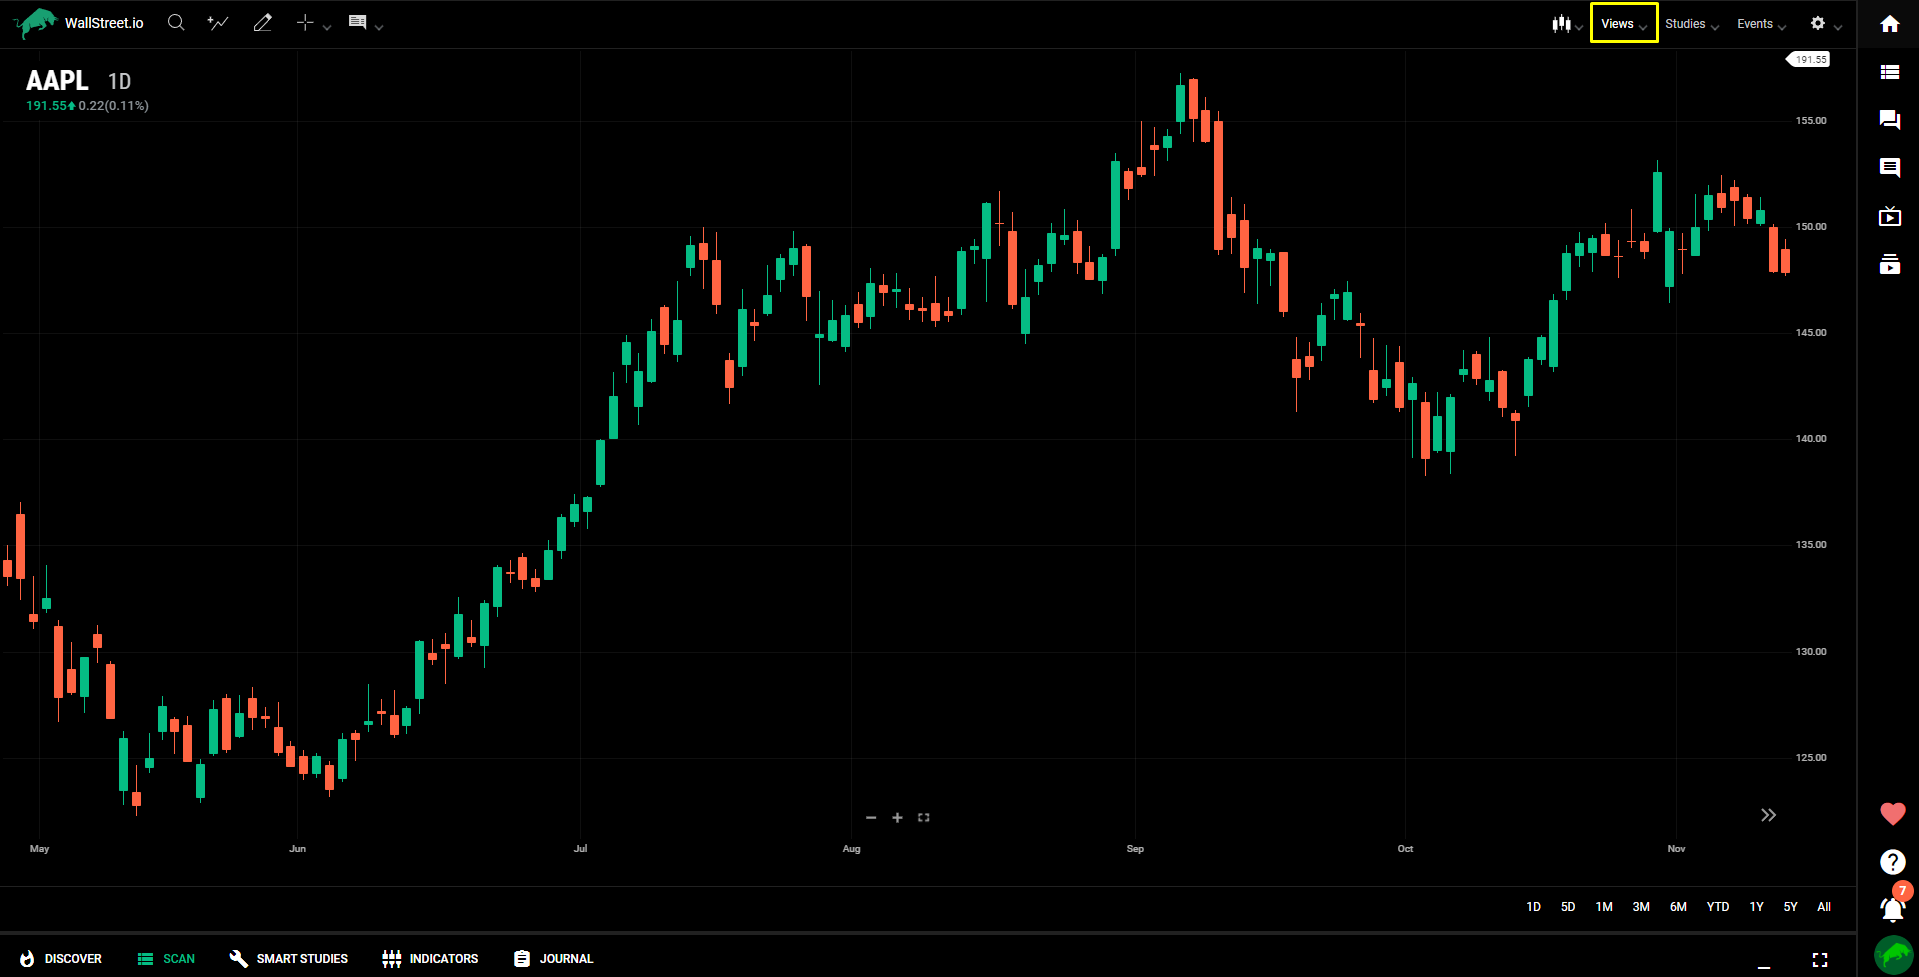
Views
A view is the chart display, including all indicators and studies associated with the chart. Use the Views menu to save chart views for later retrieval.
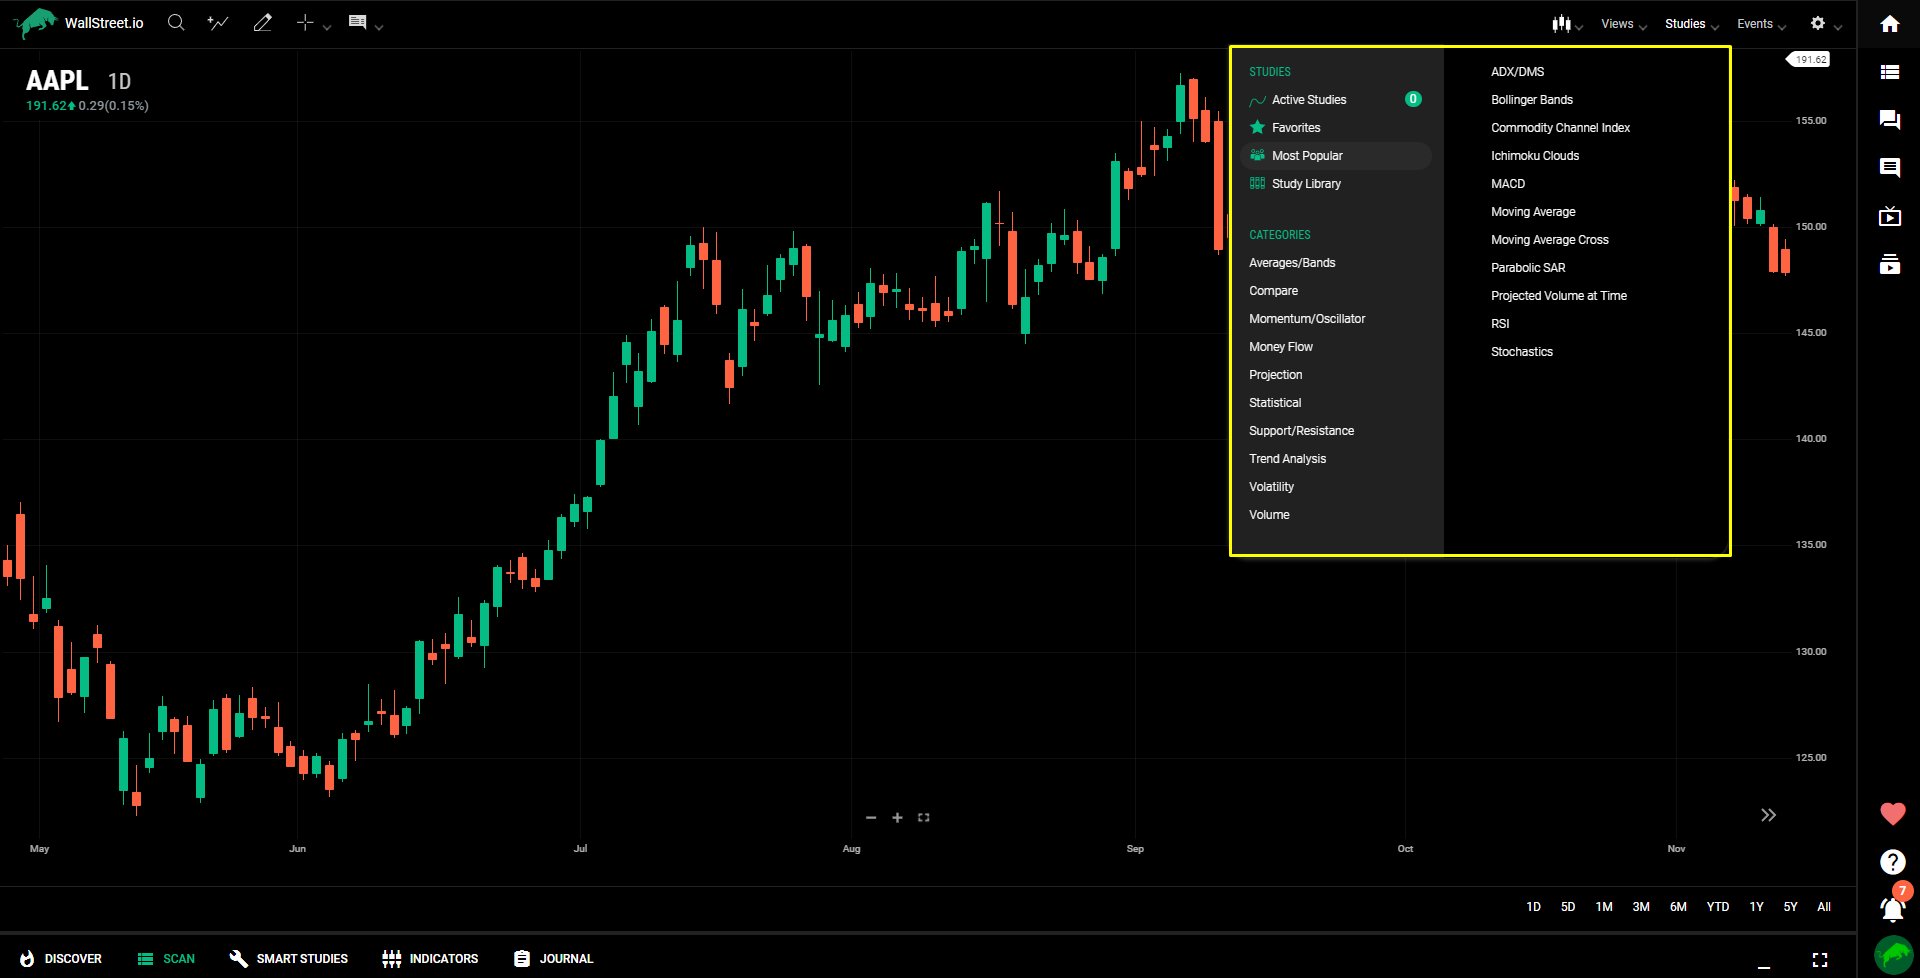
Studies
Studies are technical indicators that you add to charts from the Studies menu. For a complete list of the studies included in our library, refer to our comprehensive Studies Reference Guide.
Events
The Events menu enables you to display visual indicators of time-based events such as stock splits, dividend dates, financial filings, earning reports, and news events.
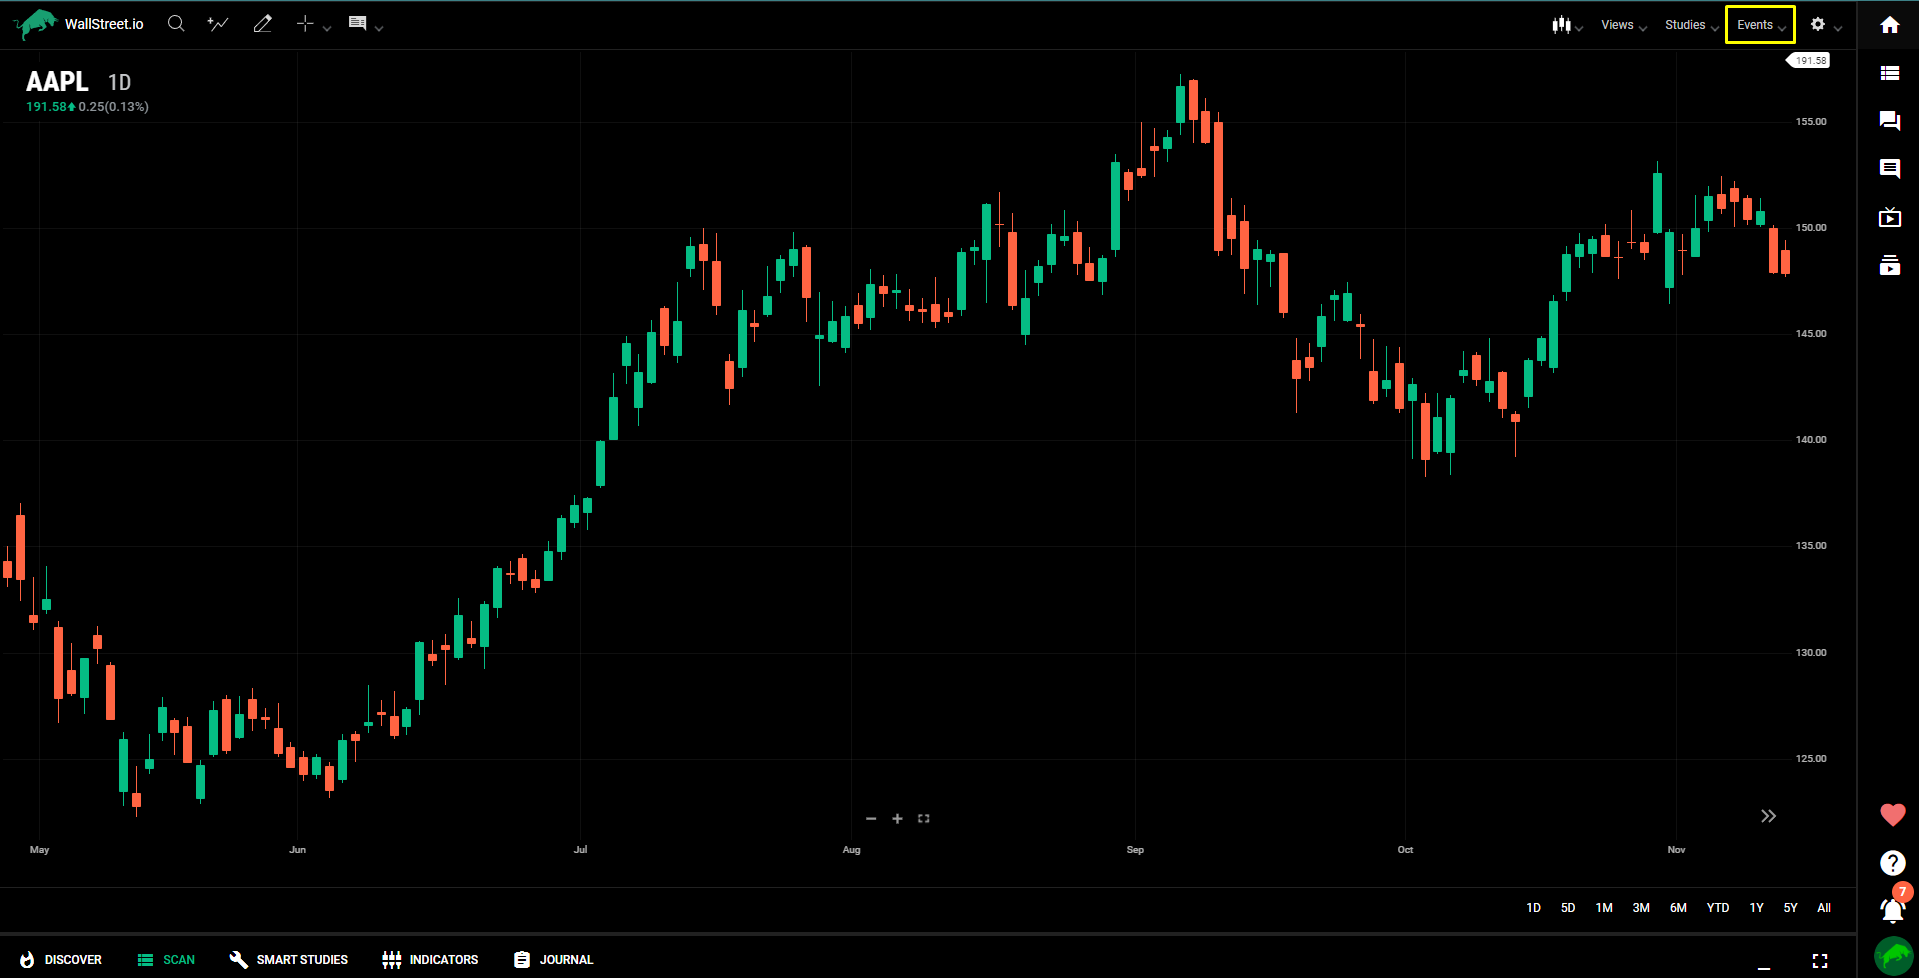
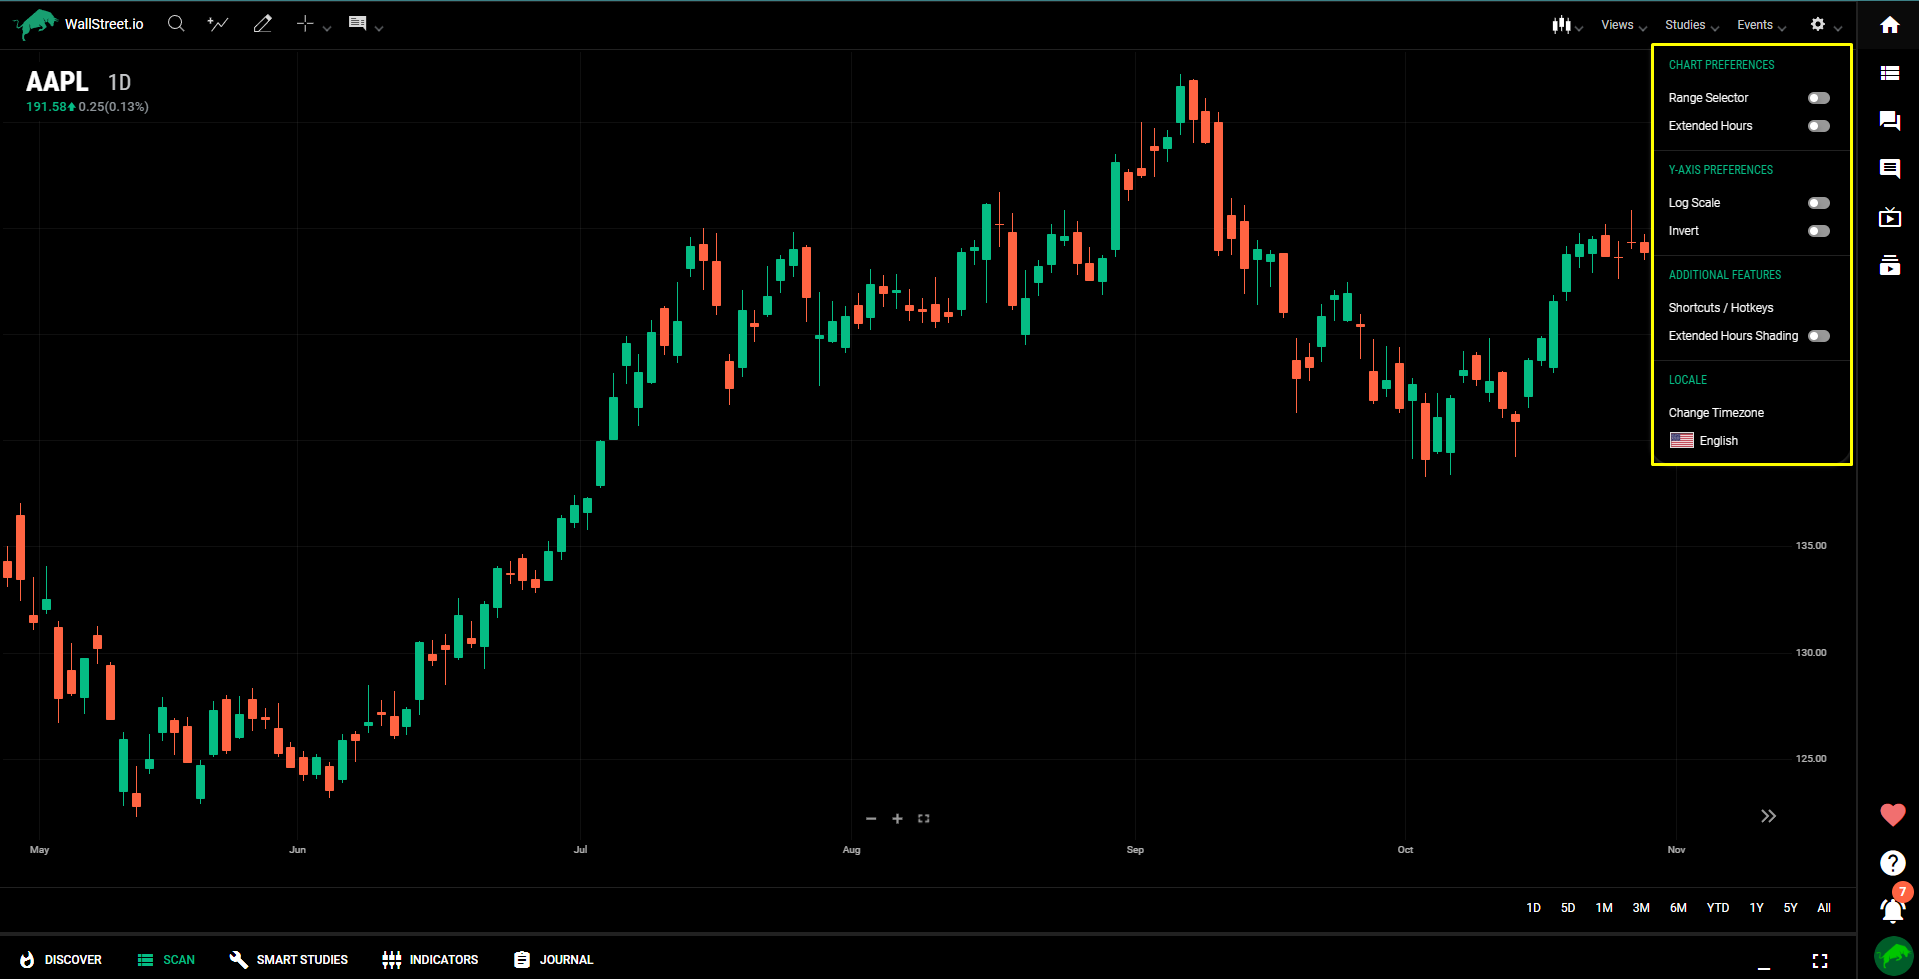
Chart Preferences
The Chart Preferences menu enables you to set a variety of preferences to display your charts just the way you want them.
You can customize your charts by adjusting settings such as a range selector, enabling or disabling extended hours, update y-axis preferences (log scale and invert), review useful shortcuts/hotkeys, and more.
For a complete description of our Chart Preferences refer to our comprehensive Reference Guide.