Drawing Tools Reference Guide
Trading, at its core, is about understanding trends, patterns, and significant levels in the stock or options market. These can help inform your decisions about when to buy or sell. But how do we make sense of these trends and patterns amidst all the numbers and lines on a chart? That's where our Drawing Tools come into play.

These are an array of sophisticated yet easy-to-use features designed to enhance your chart and strategy analysis. From essential technical analysis tools like trendlines and Fibonacci retracements to creative elements such as shapes, callouts, and doodles, our suite of drawing tools allows you to seamlessly integrate graphical representations into your charts and studies.
In the following sections, we'll take a closer look at each tool and how it can transform your chart reading skills. Whether you're a seasoned trader or just beginning your journey, understanding the functionality of these tools is the key to unlocking their full potential.
Drawing Palette controls
List view

Displays the drawing tools in a list view.
Grid view

Displays the drawing tools in a grid view.
Attach/Detach

Detaches the palette from the side of the screen, making the palette draggable anywhere on-screen.
No Tool

Deselects the current drawing tool; that is, sets the palette so that no drawing tool is in use.
Measure

Enables measurements of the chart, study, or series area.
Undo

Undoes drawing actions.
Redo

Restores drawing actions removed by Undo.
Drawing Tools dropdown menu
Enables selection of subsets of the drawing tools, such as text tools, statistics related tools, and favorites.
Drawing Tool list
With our extensive drawing and styling tools, including trend lines, average lines, channels, Fibonacci retracements, arrows, callouts, and doodles, you can confidently highlight and graphically analyze charts and studies creatively.
Fibonacci Tools
Fib projection
The Fibonacci Projection tool assists in estimating potential future price targets or extensions of a price move. By applying Fibonacci ratios to the length of a previous price swing, you can project areas where the price may reach in the future.
Fib Arc
The Fibonacci Arc tool creates curved lines based on Fibonacci ratios, which can indicate potential support or resistance levels. These arcs are drawn from important price points and can help identify areas where price reversals or significant price movements may occur.
Fib Fan
The Fibonacci Fan tool draws trend lines based on Fibonacci ratios to identify potential support and resistance levels. It helps visualize the slope of price movements and can indicate areas where the price may find support or encounter resistance.
Fib timezone
The Fibonacci Timezone tool is used to identify potential time-based price reversals or significant market movements. It divides a significant price move into time intervals based on Fibonacci ratios, indicating possible turning points or periods of increased volatility.
Fib retracement
The Fibonacci Retracement tool helps identify potential levels of support or resistance during a price correction within a trend. You can use this tool to measure the extent of a price retracement and anticipate possible areas where the price may reverse or find support/resistance.
Lines
Line
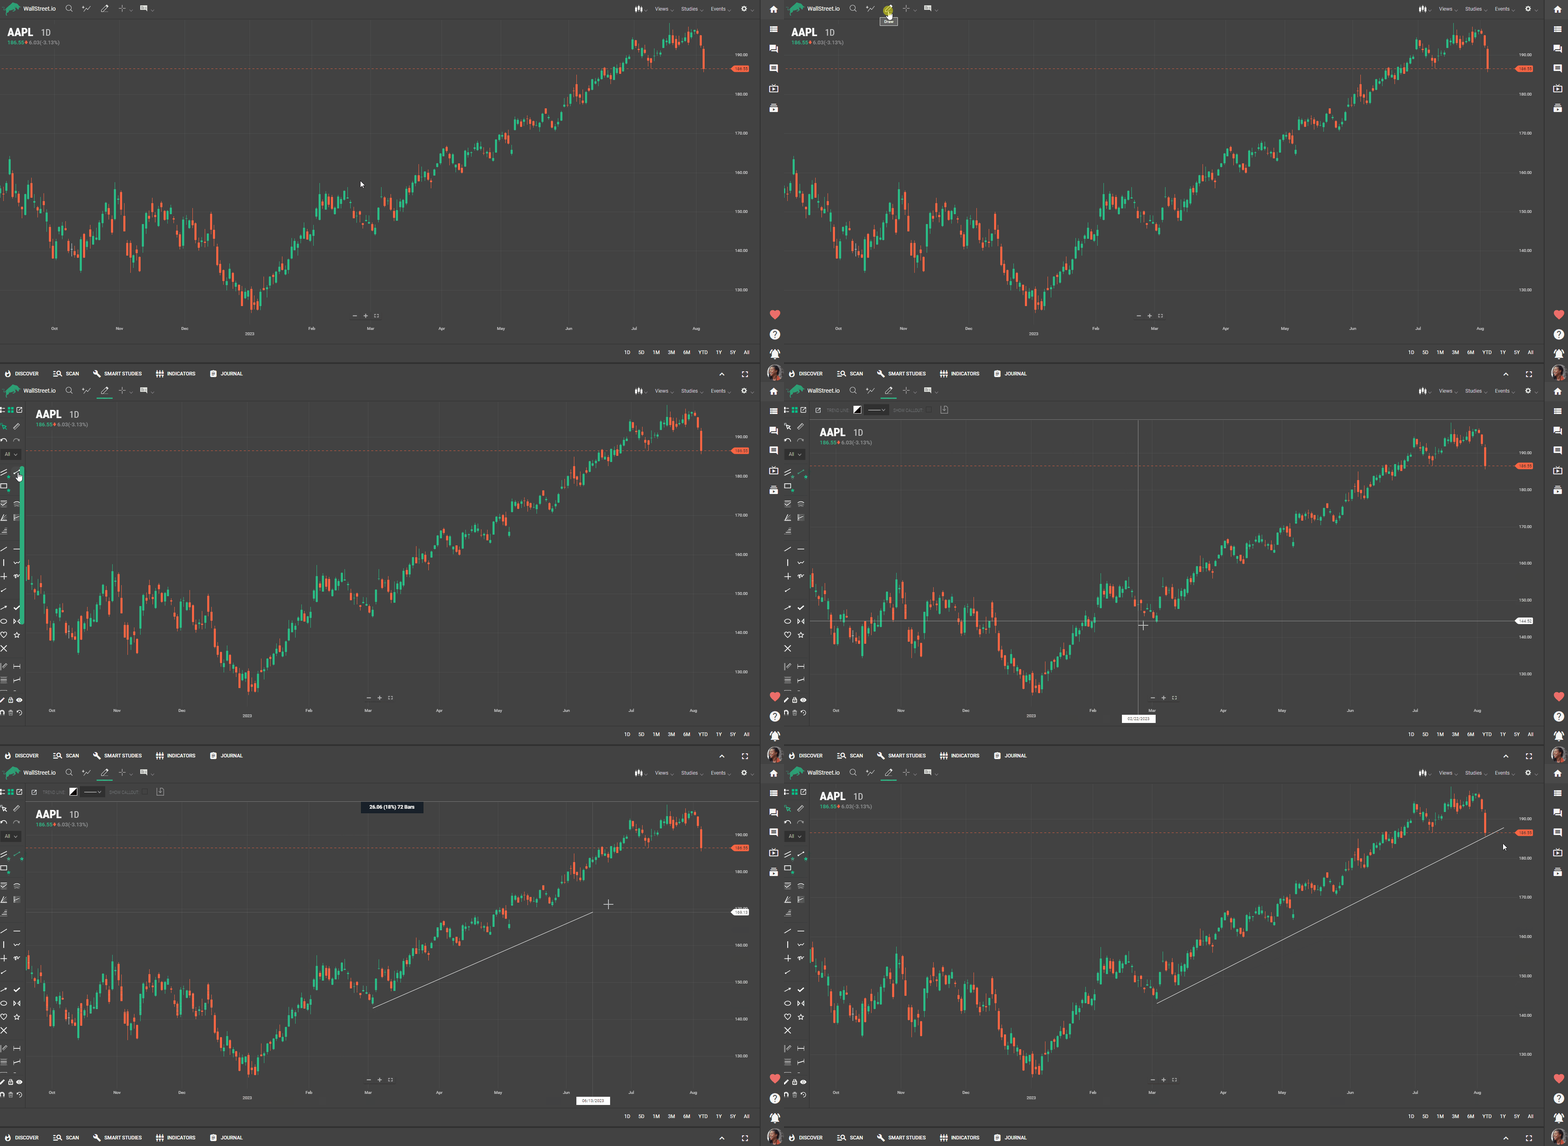
The Line tool allows you to draw a straight line at any desired angle or position on the chart. It is versatile and can be used to represent trendlines, support or resistance levels, or other relevant lines of interest.
Horizontal
The Horizontal line tool enables you to draw a straight line horizontally across the chart. It is commonly used to mark specific price levels, support, or resistance zones.
Vertical
The Vertical line tool allows you to draw a straight line vertically on the chart. It is useful for marking specific time periods or events, such as important news releases or market open/close times.
Trend Line
The Trendline tool enables you to draw a line that visually represents the trend direction and potential support or resistance levels. It is commonly used to identify and confirm trend patterns, aiding in making informed trading decisions.
Channel
The Channel tool creates parallel lines that encompass a price range, helping to identify potential support and resistance levels within a trend. You can use channels to visualize price movements and potential trading opportunities within the defined range.
Continuous
The Continuous line tool allows you to draw free-form lines on the chart without any restrictions. It provides flexibility for creating custom lines or annotations to highlight specific areas or patterns on the chart.
Crossline
The Crossline tool enables you to draw a horizontal and vertical line that intersect at a specific point on the chart. It helps identify precise price levels and facilitates comparative analysis between different time periods or data points.
Doodle
The Doodle tool allows you to draw free-form lines, shapes, or annotations on the chart. It provides a creative way to add personalized markings, notes, or drawings to emphasize specific elements or observations.
Ray
The Ray tool allows you to draw a straight line that extends infinitely in one direction from a specific starting point. It helps identify potential price targets or levels of interest based on the line's angle and position.
Markings
Arrow
The Arrow marking is a symbol in the shape of an arrow, commonly used to indicate the direction of a trend or important price movement. You can use arrows to visually depict potential entry or exit points, trend changes, or significant market events.
Rectangle
The Rectangle marking is a shape in the form of a rectangle or square, used to enclose and emphasize specific areas or patterns on the chart. You can use rectangles to highlight support or resistance zones, chart patterns, or consolidation areas.
Check
The Check marking is a symbol in the shape of a checkmark or tick, often used to indicate the completion or achievement of a specific condition or goal. It is employed to mark specific points on the chart that meet certain criteria or confirm a particular pattern or signal.
Ellipse
The Ellipse marking is a shape in the form of an ellipse or oval, used to highlight specific areas or patterns on the chart. It’s often used to enclose regions of interest, potential support or resistance zones, or consolidation patterns.
Focus
The Focus marking is a symbol that draws attention to a particular area or point on the chart. It helps users emphasize or prioritize specific data points, levels, or patterns during analysis.
Heart
The Heart marking is a symbol in the shape of a heart, sometimes used to mark emotional or sentimental aspects related to the chart or specific price levels. It is not typically employed for technical analysis but can serve as a personal notation or reminder for traders.
Star
The Star marking is a symbol in the shape of a star, used to indicate or highlight important data points or events on the chart. It is commonly employed to draw attention to specific levels, patterns, or price movements that traders consider significant.
Cross
The Cross marking is a symbol in the shape of a cross, representing a point of interest or a significant event on the chart. It is used to mark specific levels, prices, or time periods for reference or analysis purposes.
Statistics
Measurement line
The Measurement Line allows users to measure the distance or change in price between two points on the chart. It helps quantify price movements, assess market volatility, or determine the duration of specific price patterns or trends.
Average Line
The Average Line is a tool that calculates and plots the average value of a selected data series on the chart. It helps smooth out price fluctuations and provides a visual reference for identifying the overall trend direction.
Quadrant Lines
Quadrant Lines divide the chart into four quadrants based on specific reference points or price levels. They provide a visual framework for assessing price movements, trend changes, or identifying potential support and resistance areas within each quadrant.
Regression Line
The Regression Line is a statistical tool that plots a straight line through a series of data points to estimate the overall trend. It helps identify the general direction of price movement and serves as a visual guide for understanding trend strength and potential reversals.
Tirone levels
Tirone Levels are horizontal lines drawn on the chart at specific percentage intervals above and below a selected reference point. They help identify potential support and resistance levels based on the price's historical percentage movements.
Volume Profile
The Volume Profile is a statistical tool that displays the volume traded at each price level over a specified period. It helps identify areas of high trading activity (volume nodes) and potential support or resistance levels based on the volume distribution.
Technicals
Elliott Wave
The Elliott Wave is a technical analysis concept that identifies recurring price patterns and wave structures to forecast future price movements. It is based on the idea that markets move in predictable waves consisting of impulse waves (with the trend) and corrective waves (against the trend).
Gann Fan
The Gann Fan is a tool based on the principles of W.D. Gann, a famous trader and analyst. It consists of diagonal trendlines drawn at specific angles to identify potential support and resistance levels. The Gann Fan is used to analyze price and time relationships and helps you determine future price targets and trend direction.
Gartley
The Gartley pattern is a specific harmonic price pattern that incorporates Fibonacci retracement and extension levels. It helps you identify potential turning points and reversals in the market based on specific price ratios and geometric patterns.
Pitchfork
The Pitchfork, also known as Andrews' Pitchfork, is a tool that uses three parallel trendlines to identify potential support and resistance levels. It is primarily used to analyze and project future price movements within the confines of a trending market.
Speed resistance arc
The Speed Resistance Arc is a curved line that represents a time and price resistance zone. It helps you identify potential levels where price acceleration may slow down or encounter resistance.
Speed resistance Line
The Speed Resistance Line is a straight line that connects two significant price points and helps you identify potential levels of support or resistance. It assists in analyzing price movements and determining trend strength and potential reversals.
Time cycle
Time Cycle analysis involves identifying recurring patterns and cycles in the market based on historical price data. It helps you anticipate potential turning points or periods of increased volatility based on past timing patterns.
Text
Annotation
The Annotation tool enables users to add text-based comments or notes directly on the chart. It is useful for recording observations, adding explanations, or highlighting specific events or patterns.
Callout
The Callout allows you to create text-based callout boxes that point to a specific area or element on the chart. It is effective for drawing attention to particular data points, price levels, or important information within the chart.
Drawing Tools Options
Stay in Drawing Mode

This allows you to continue drawing or performing actions without exiting the drawing mode. When enabled, this feature keeps you in the drawing mode even after creating a drawing, so it eliminates the need to repeatedly re-enter the drawing mode, providing a more seamless and efficient drawing experience.
Lock Drawings

This helps protect your added drawings on the chart. When you activate the "Lock Drawings" button, it prevents accidental modifications, ensuring that your drawings remain fixed in their positions.
Toggle Visibility Drawings

Turns the drawings on or off without completely deleting them.
Magnet

The magnet tool is used to help users place drawings in an accurate way on an OHLC point. Magnetizing a tool to a line provides precise placement of the drawing on the line.
Off: This is the default setting where the Magnet feature is inactive. Your drawings are placed exactly where your mouse pointer goes, with no added assistance.

Green with Green Bottom Semi-Circle: Engage the Magnet’s full power across the entire chart. In this mode, a blue dot automatically appears to mark the high or low of the nearest candlestick, aligning with the Y-axis of the crosshair. The location—high or low—depends on the crosshair's X-axis position in relation to the candlestick. Drawings will automatically snap to these high or low points.

Green: For a more localized approach, this setting activates a small, invisible radius around your mouse pointer. As you move close to a candlestick within this radius, a blue dot emerges to mark the intersection of the Y-axis crosshair with the nearest high or low point on the candlestick. This aids in more precise placement, yet still allows the flexibility to place drawings anywhere on the chart.

Important Note: The Magnet feature is exclusively for initial placements and won't affect any subsequent repositioning of your drawings.
Clear all drawings

Removes all drawings from the display.
Restore default parameters

Restores all drawing settings to their default values.
Context Menu
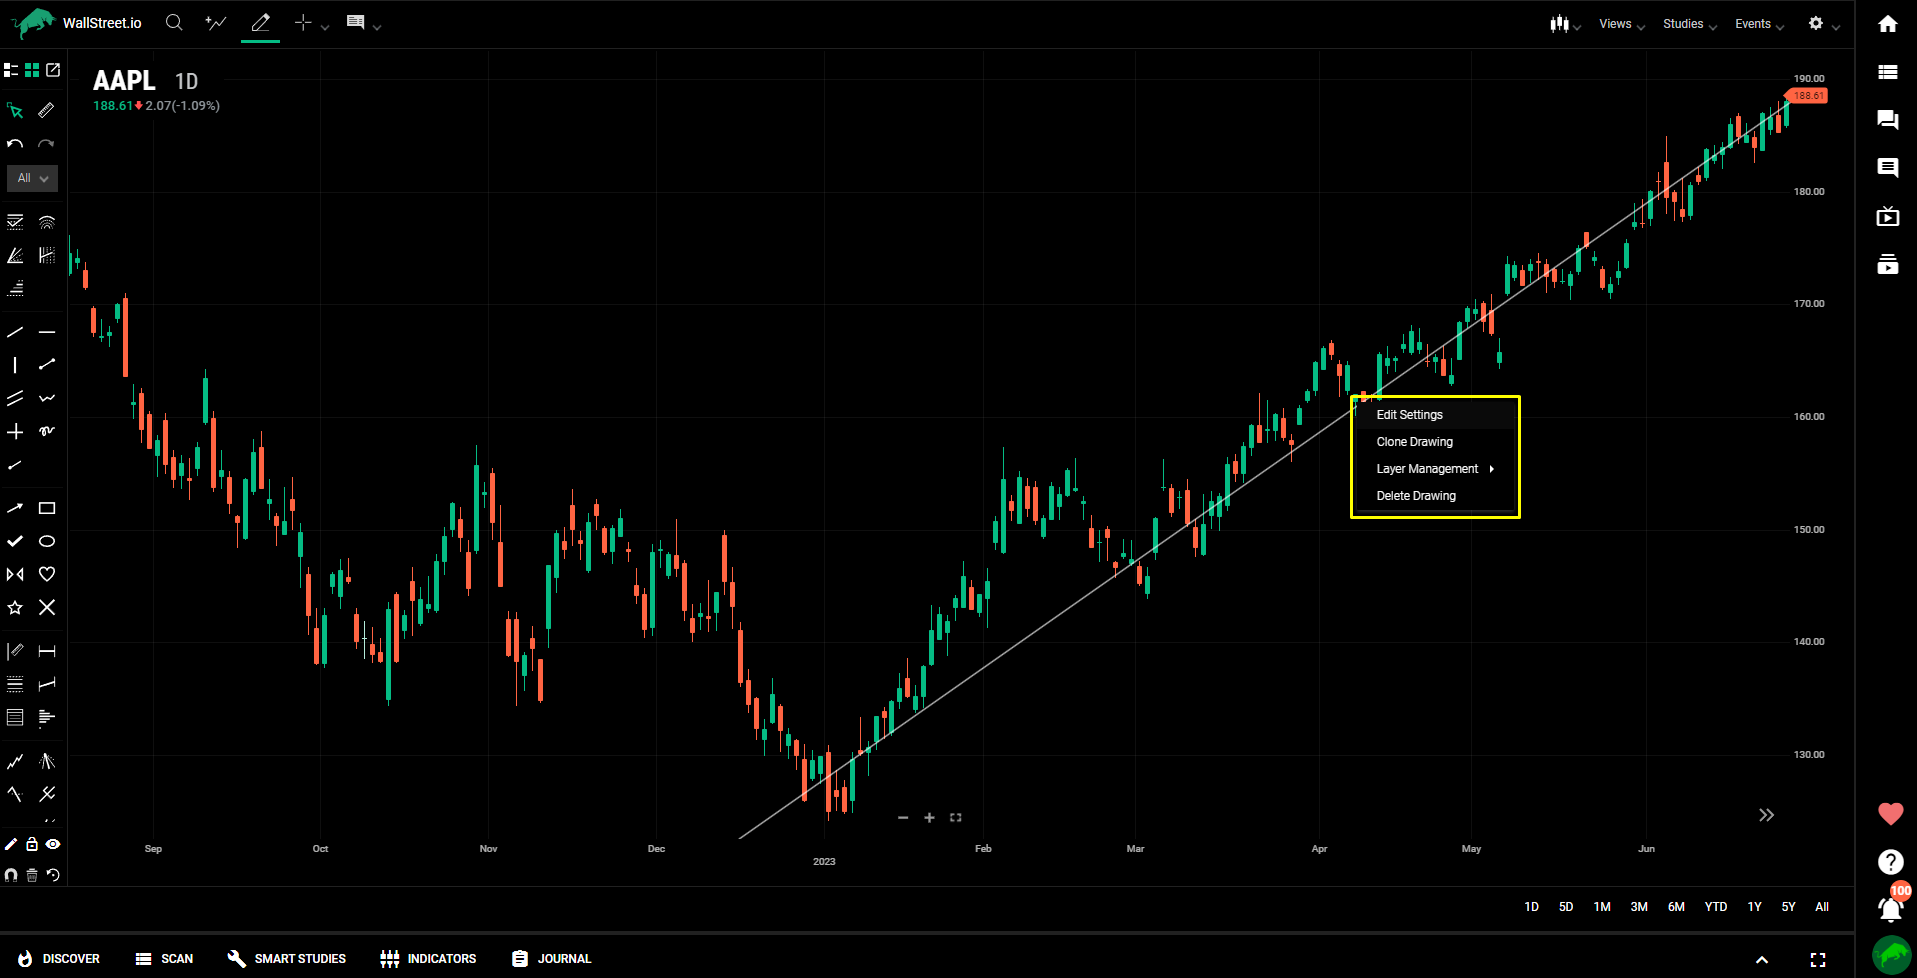
To edit or delete a drawing on desktop browsers, right-click the drawing to access a context menu, which provides the following options:

Edit Settings: Accesses the style palette (see Style palette), which enables configuration of font, color, and other style settings.
Clone Drawing: Creates a copy of the drawing, which can be applied elsewhere on the chart, study, or series.
Layer Management: Positions overlapping drawings on the z-axis, relative to one another. Brings a drawing forward or sends it backward, moves it to the top or bottom of a stack of drawings.
Delete Drawing: Removes the drawing from the display.
On touch devices
● Double tap a drawing to delete it; or tap the drawing to highlight it, then tap the delete icon to remove the drawing.
● To edit the drawing settings, tap the drawing to highlight it, then tap the settings icon to open the style palette.
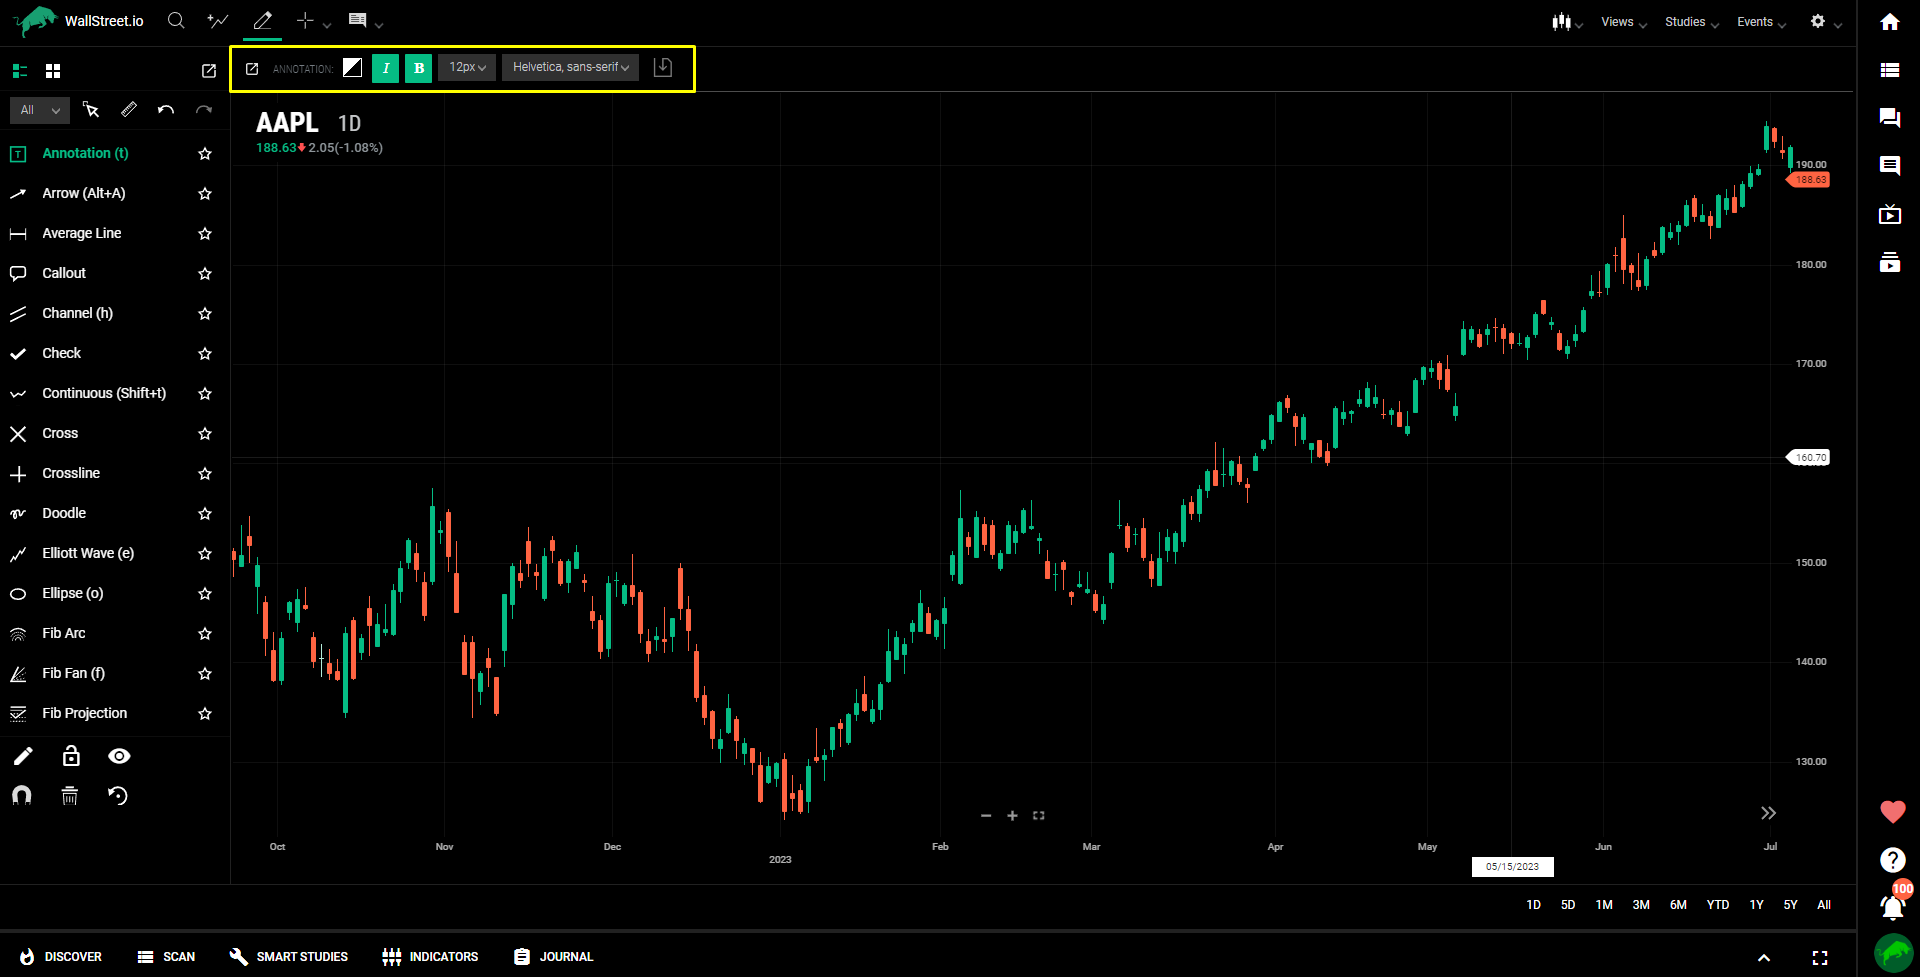
Drawing Style palette

The style palette enables you to style lines and text to your preferences:
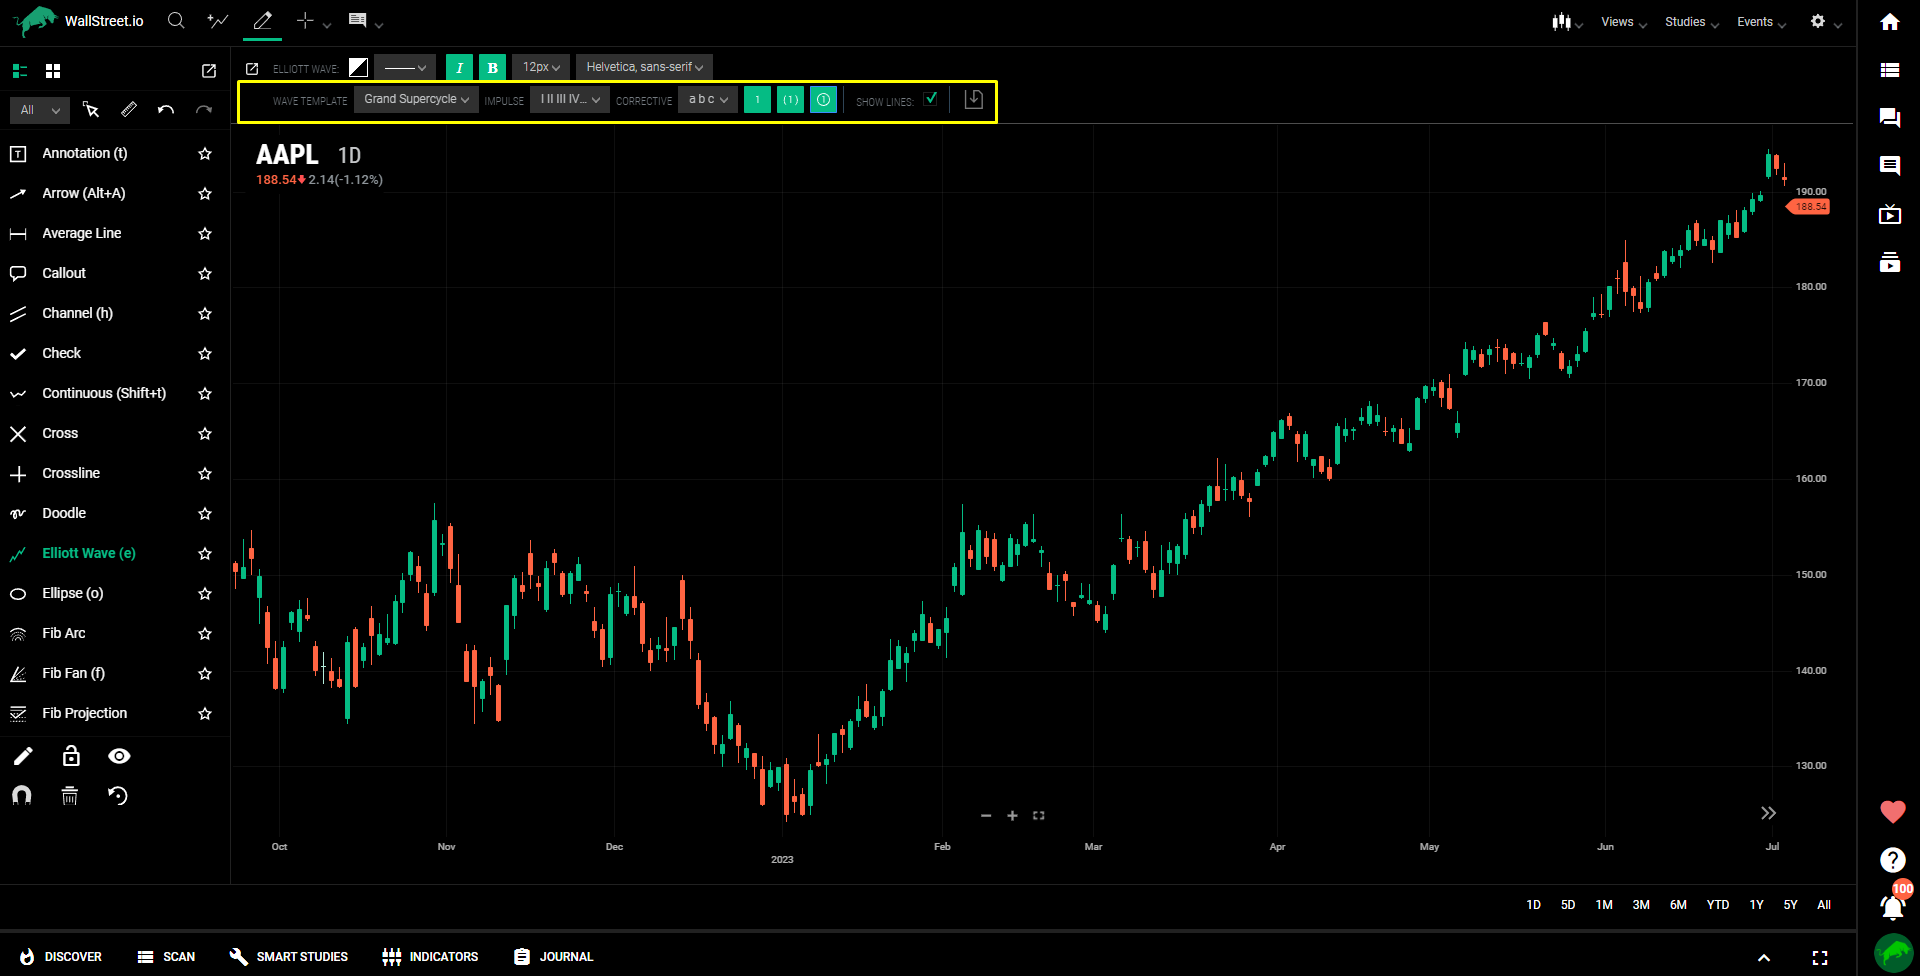
Configuration toolbar (for Elliott Wave)


 Discover Tab Reference Guide
 Discover Tab How-To Guide
 Smart Studies How-To Guide
 Smart Studies Reference Guide
 Scan Tab Reference Guide
 Scan Tab How-To Guide
 Watchlists How-To guide
 Watchlists Reference Guide
 Chatrooms Reference Guide
 Community Wall How-To Guide
 Community Wall Reference Guide
 Streams Reference Guide
 Streams How-To Guide