ADX/DMS
The Average Directional Index (ADX) and the Directional Movement System (DMS) are powerful technical analysis tools that can help you assess the strength and direction of a market trend.
1: Add the ADX/DMS to your Chart
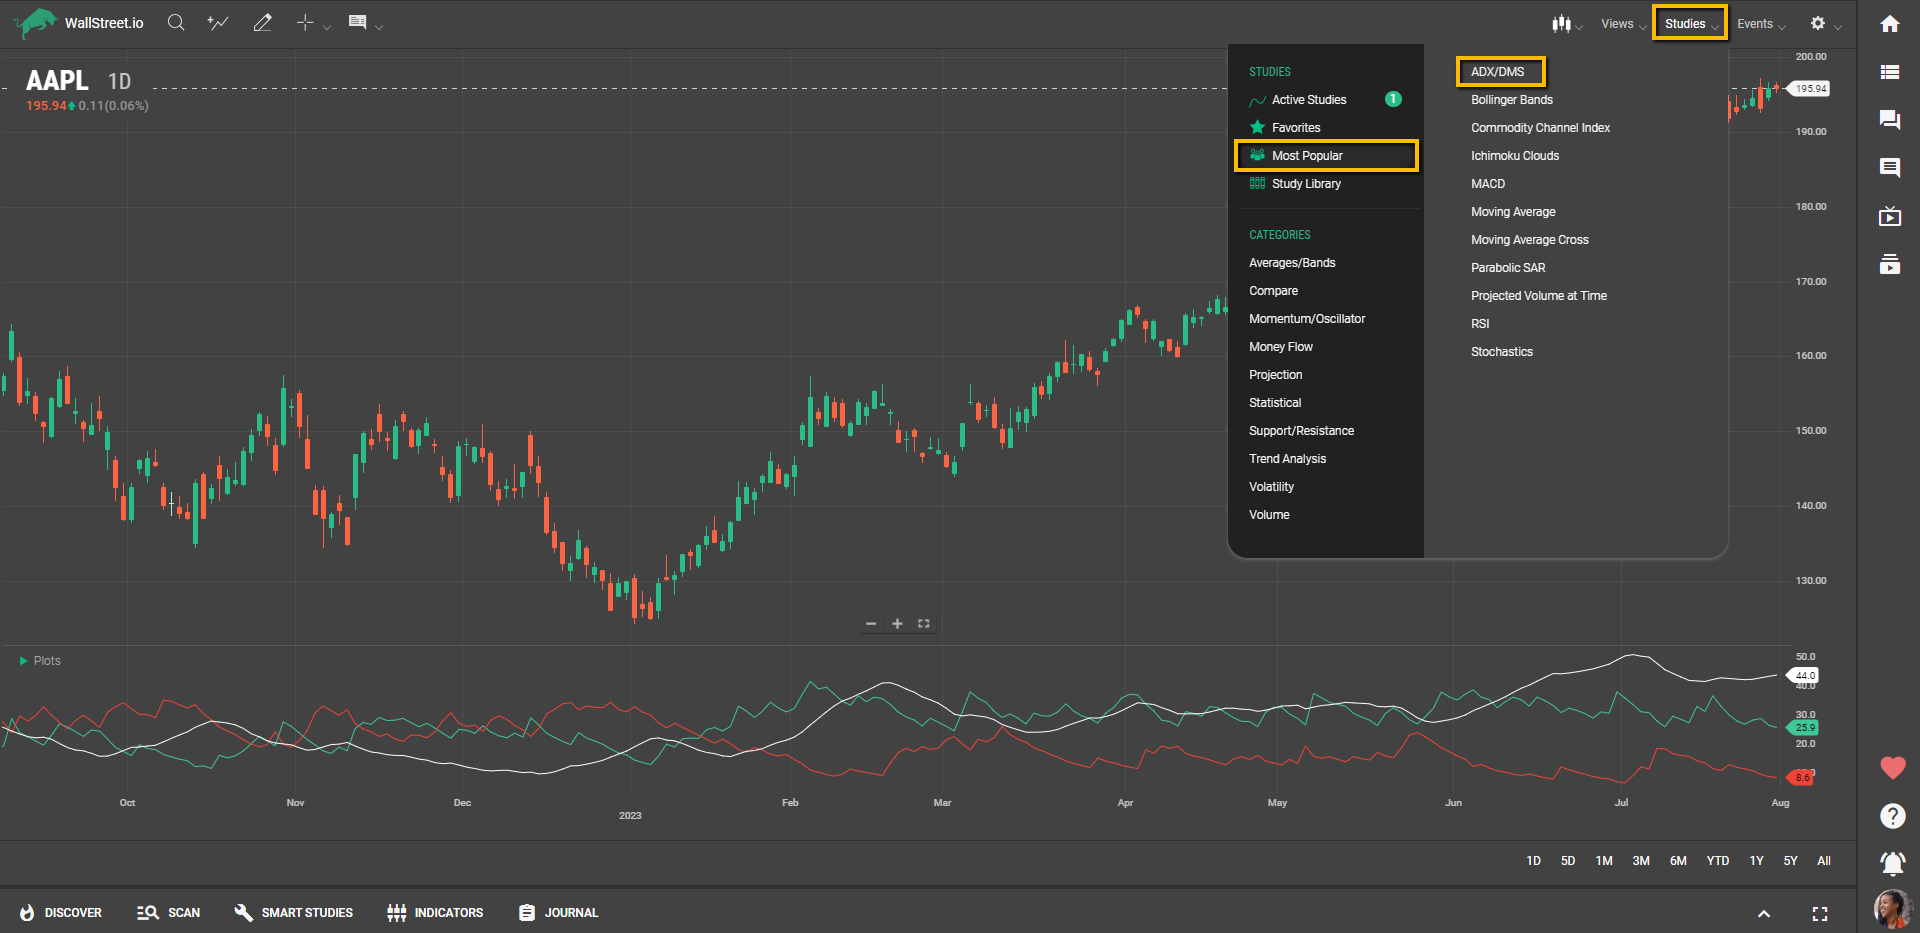
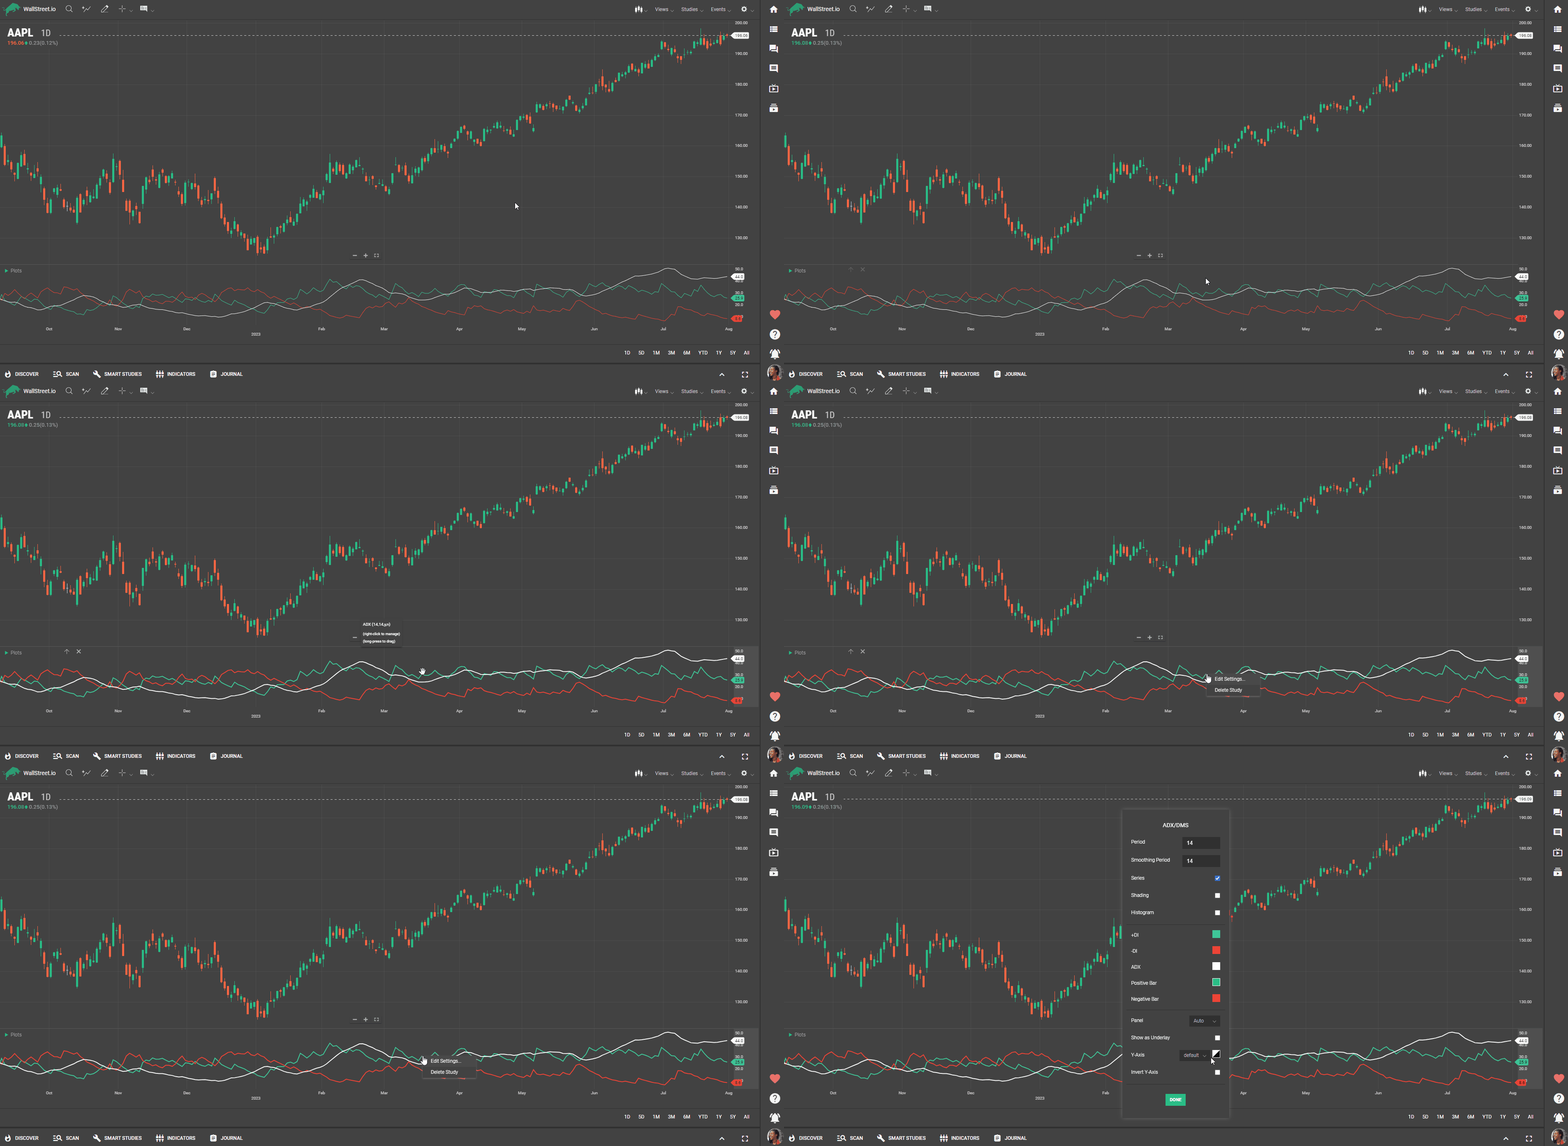
Look for the ADX/DMS indicator from the list of our available Studies. Adjust the settings if desired, such as the period length (commonly set to 14) or the color scheme for better visualization. You can do this by right-clicking on the ADX/DMS and choosing “Edit Settings”.
2: Understand the Components of the ADX/DMS
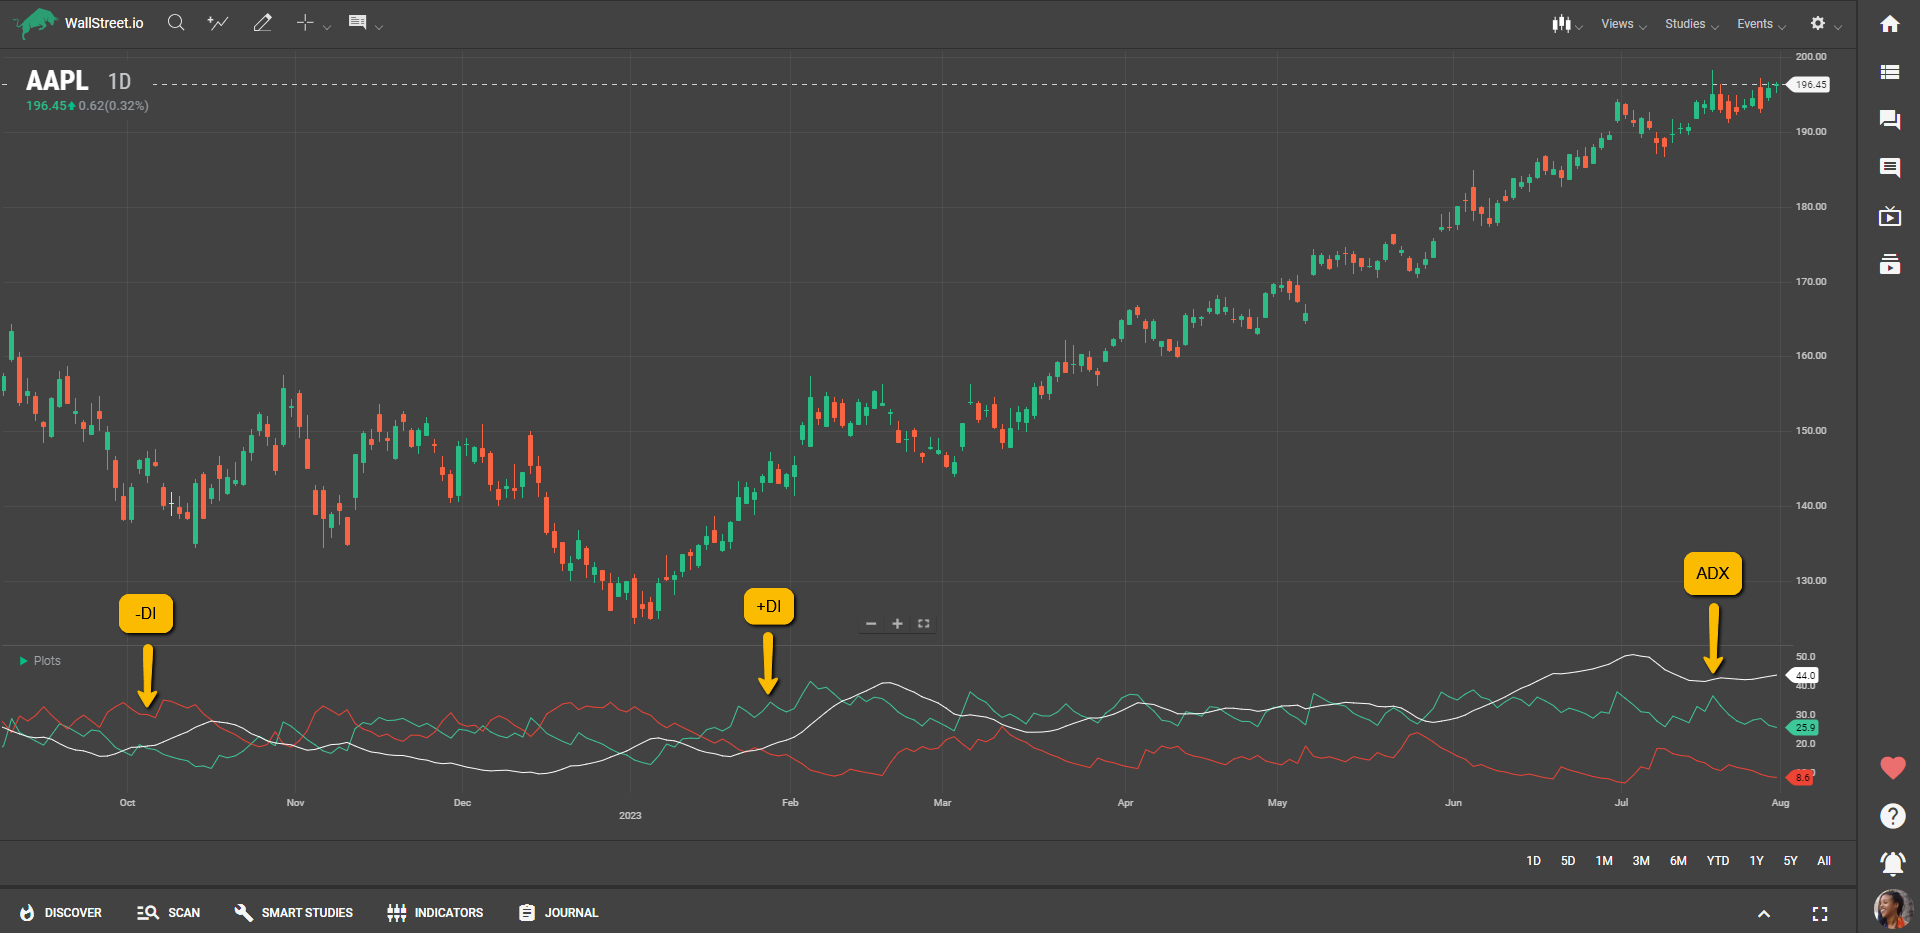
The ADX line represents the strength of the trend, ranging from 0 to 100. A higher ADX value indicates a stronger trend.The Positive Directional Indicator (+DI) line shows the strength of upward price movement.The Negative Directional Indicator (-DI) line shows the strength of downward price movement.
3: Interpret the ADX Values
ADX values below 20 indicate a weak or non-existent trend, suggesting a ranging or consolidating market.ADX values between 20 and 40 suggest a developing trend with moderate strength.ADX values above 40 indicate a strong trend.4: Analyze the +DI and -DI Lines
When the +DI line is above the -DI line, it indicates a bullish trend.When the -DI line is above the +DI line, it indicates a bearish trend.Crossovers between the +DI and -DI lines can signal potential trend reversals.Tips and best uses:
Use the ADX to filter out noise and identify trending markets, which are more favorable for trend-following strategies.Adjust the period length of the ADX/DMS based on your trading style and timeframe, but be cautious of excessively short periods that may generate false signals.To better understand the concepts used in this guide, check out our ADX/DMS Reference Guide.


 Discover Tab Reference Guide
 Discover Tab How-To Guide
 Smart Studies How-To Guide
 Smart Studies Reference Guide
 Scan Tab Reference Guide
 Scan Tab How-To Guide
 Watchlists How-To guide
 Watchlists Reference Guide
 Chatrooms Reference Guide
 Community Wall How-To Guide
 Community Wall Reference Guide
 Streams Reference Guide
 Streams How-To Guide