Commodity Channel Index (CCI)
The Commodity Channel Index (CCI) is a versatile technical indicator that can help traders identify overbought and oversold conditions, potential trend reversals, and market divergences. Follow these simple steps to effectively use the CCI:
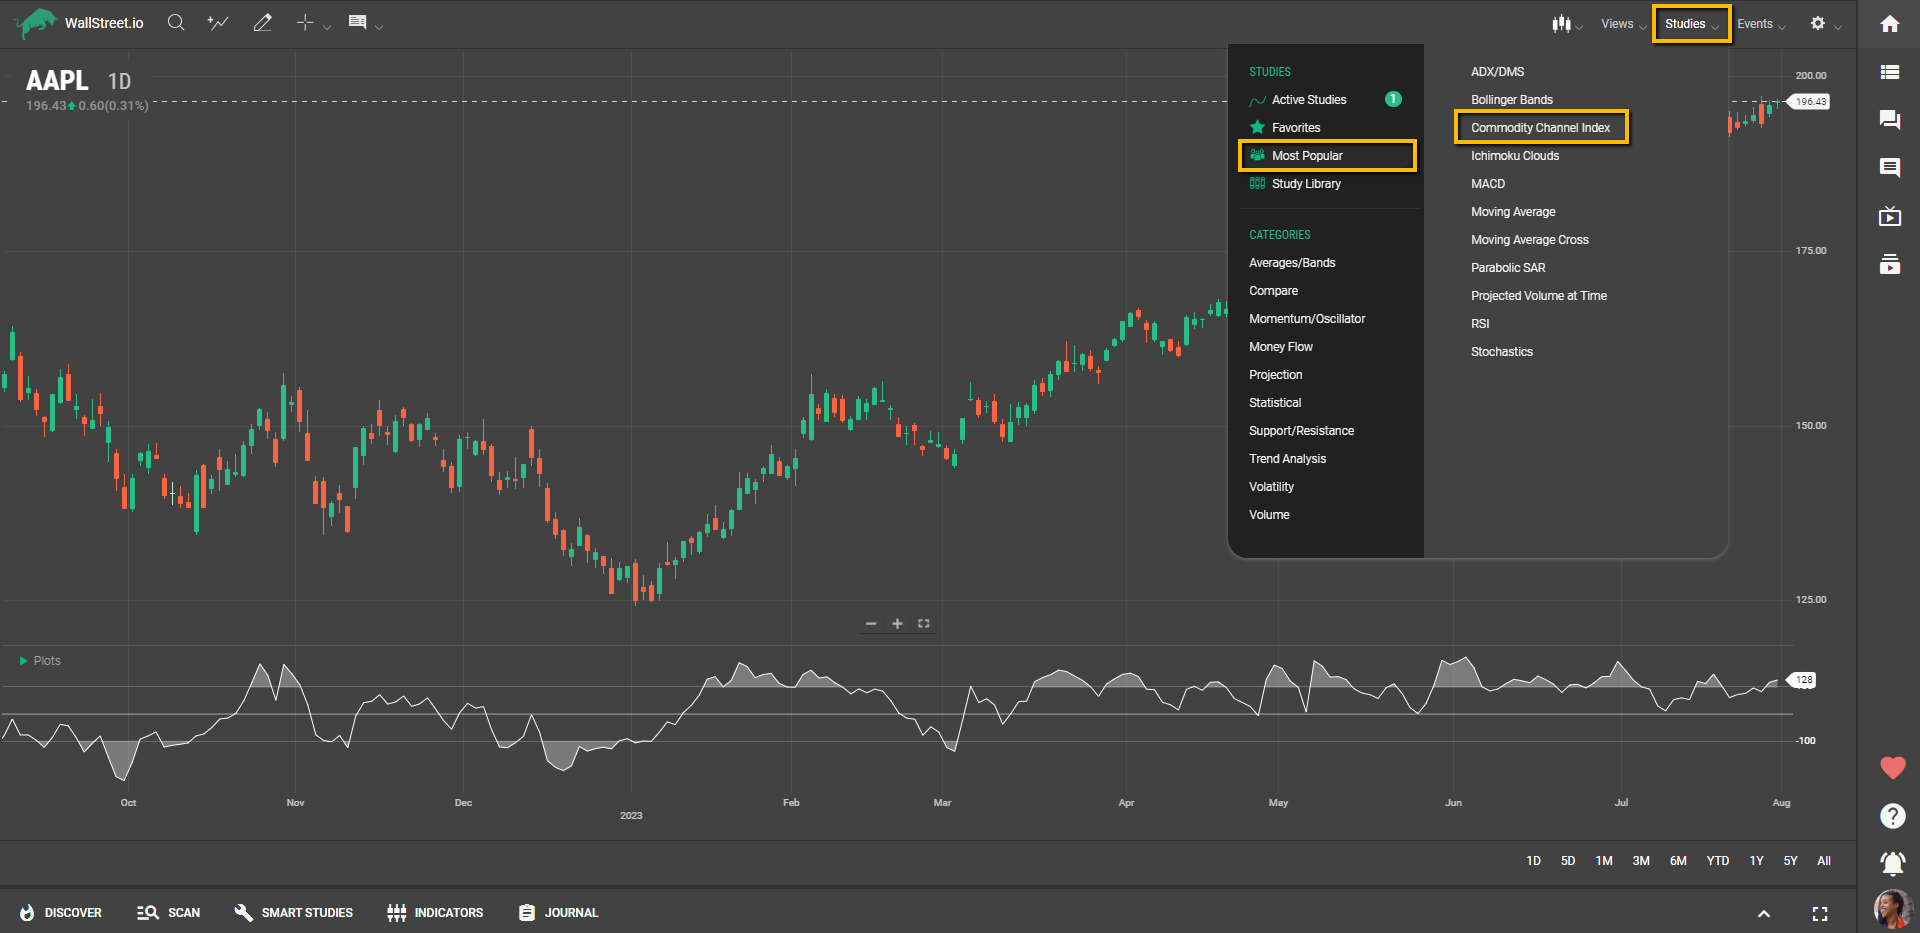
1: Add the CCI Indicator to Your Chart
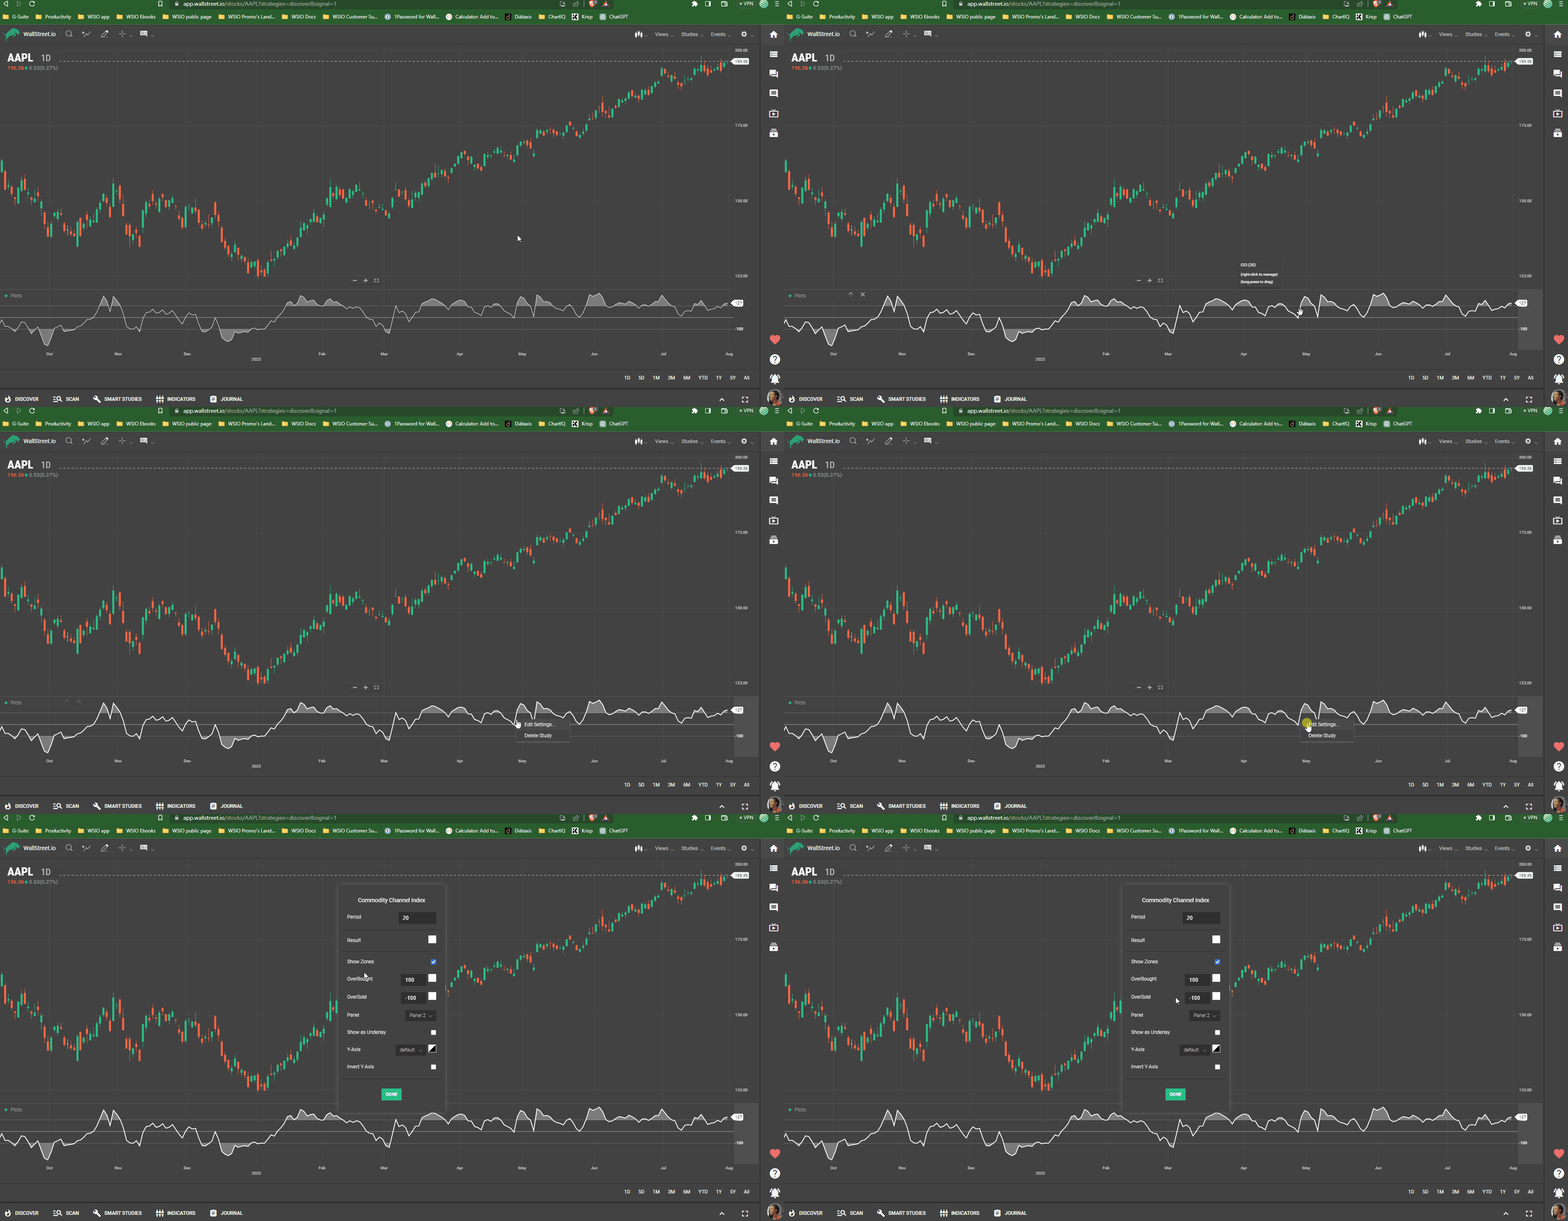
Select the Commodity Channel Index from the list of our available Studies.  The CCI is typically calculated over a period of 20, although you can adjust the period based on your trading preferences and the time frame you are analyzing by right-clicking on it and clicking on “Edit Settings…”
2: Understand CCI Readings
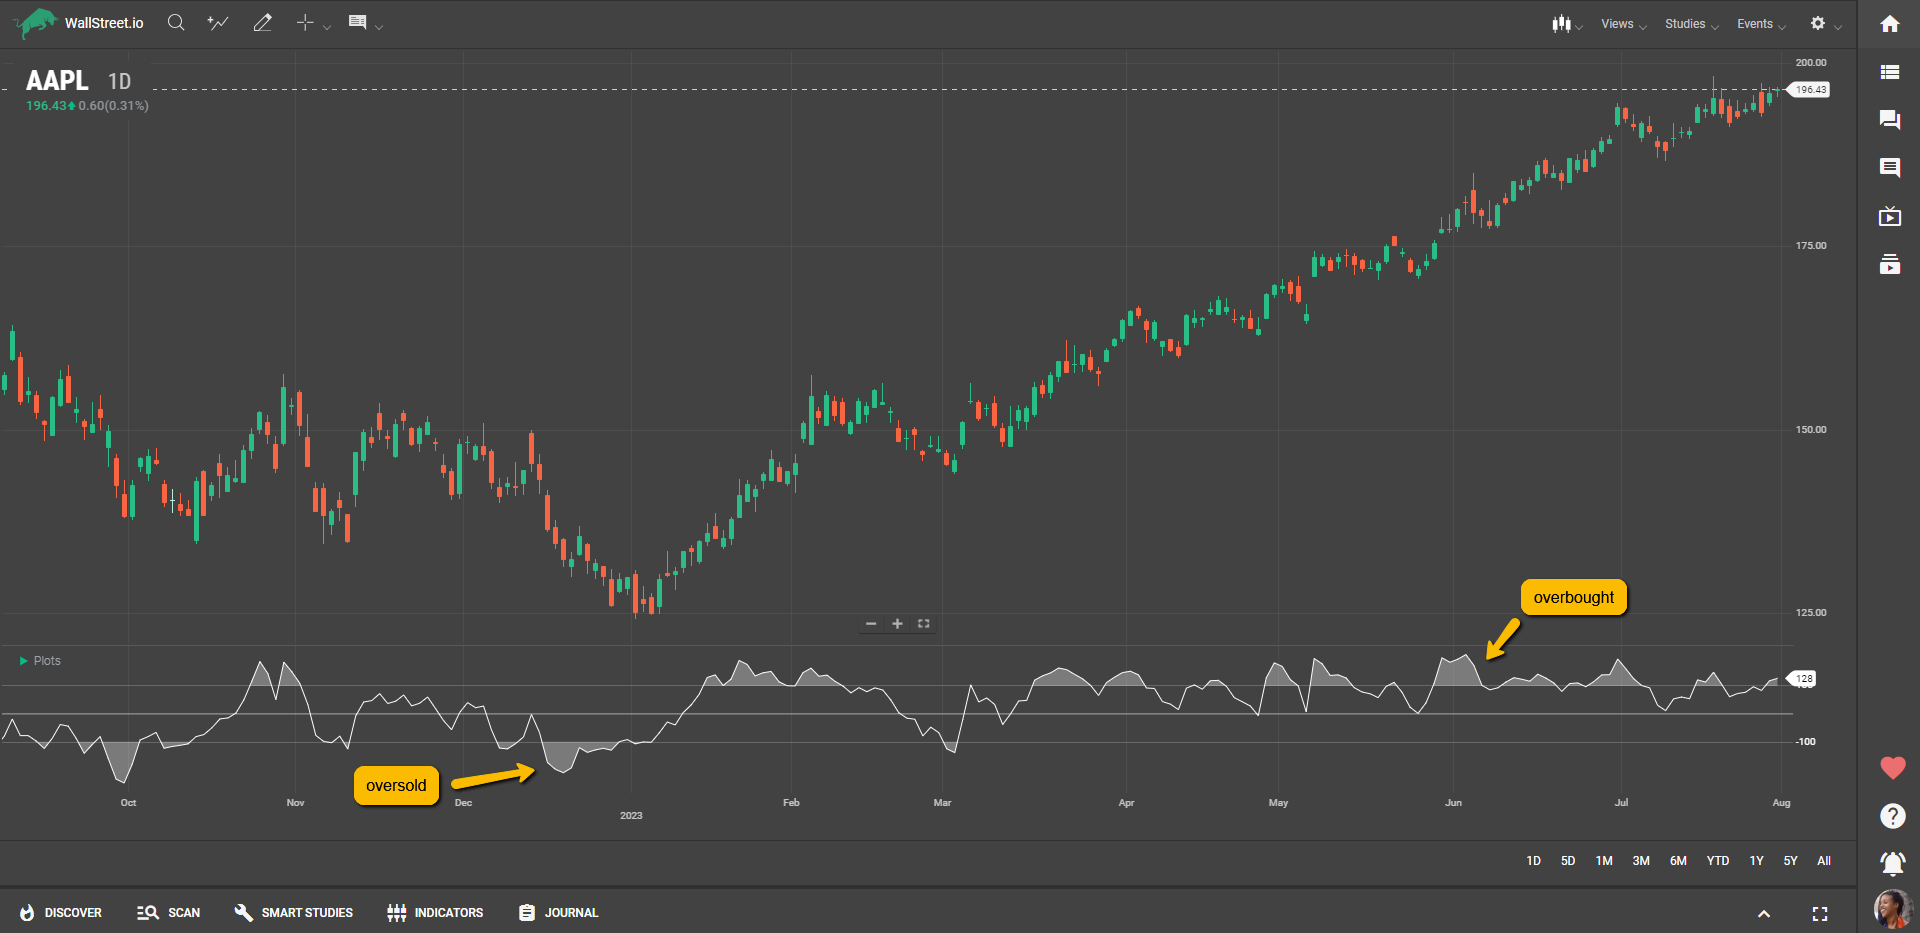
The CCI is displayed as a line that fluctuates above and below a centerline (usually set at zero).Positive CCI values above the centerline indicate overbought conditions, suggesting the price may be due for a downward correction.Negative CCI values below the centerline indicate oversold conditions, suggesting the price may be due for an upward bounce.
3: Identify CCI Divergences
Pay attention to divergences between the CCI and price action. A bullish divergence occurs when the price makes lower lows while the CCI forms higher lows, indicating a potential bullish reversal. Conversely, a bearish divergence occurs when the price makes higher highs while the CCI forms lower highs, suggesting a potential bearish reversal.4: Use CCI Overbought and Oversold Levels
Consider using overbought and oversold levels to interpret trade signals. For example, you can set custom thresholds (e.g., +100 and -100) to identify extreme CCI readings that may forecast potential price reversals.When the CCI moves above the overbought threshold, it suggests that the price may be due for a downward correction.When the CCI moves below the oversold threshold, it suggests that the price may be due for an upward bounce.Tips and Best Uses:
The CCI is most effective in ranging markets, where it can help identify potential reversals near support and resistance levels.Adjust the CCI period to match your trading time frame and the volatility of the instrument you are analyzing.


 Discover Tab Reference Guide
 Discover Tab How-To Guide
 Smart Studies How-To Guide
 Smart Studies Reference Guide
 Scan Tab Reference Guide
 Scan Tab How-To Guide
 Watchlists How-To guide
 Watchlists Reference Guide
 Chatrooms Reference Guide
 Community Wall How-To Guide
 Community Wall Reference Guide
 Streams Reference Guide
 Streams How-To Guide